Visualize your data – easy and fast!
Flexible Dashboards
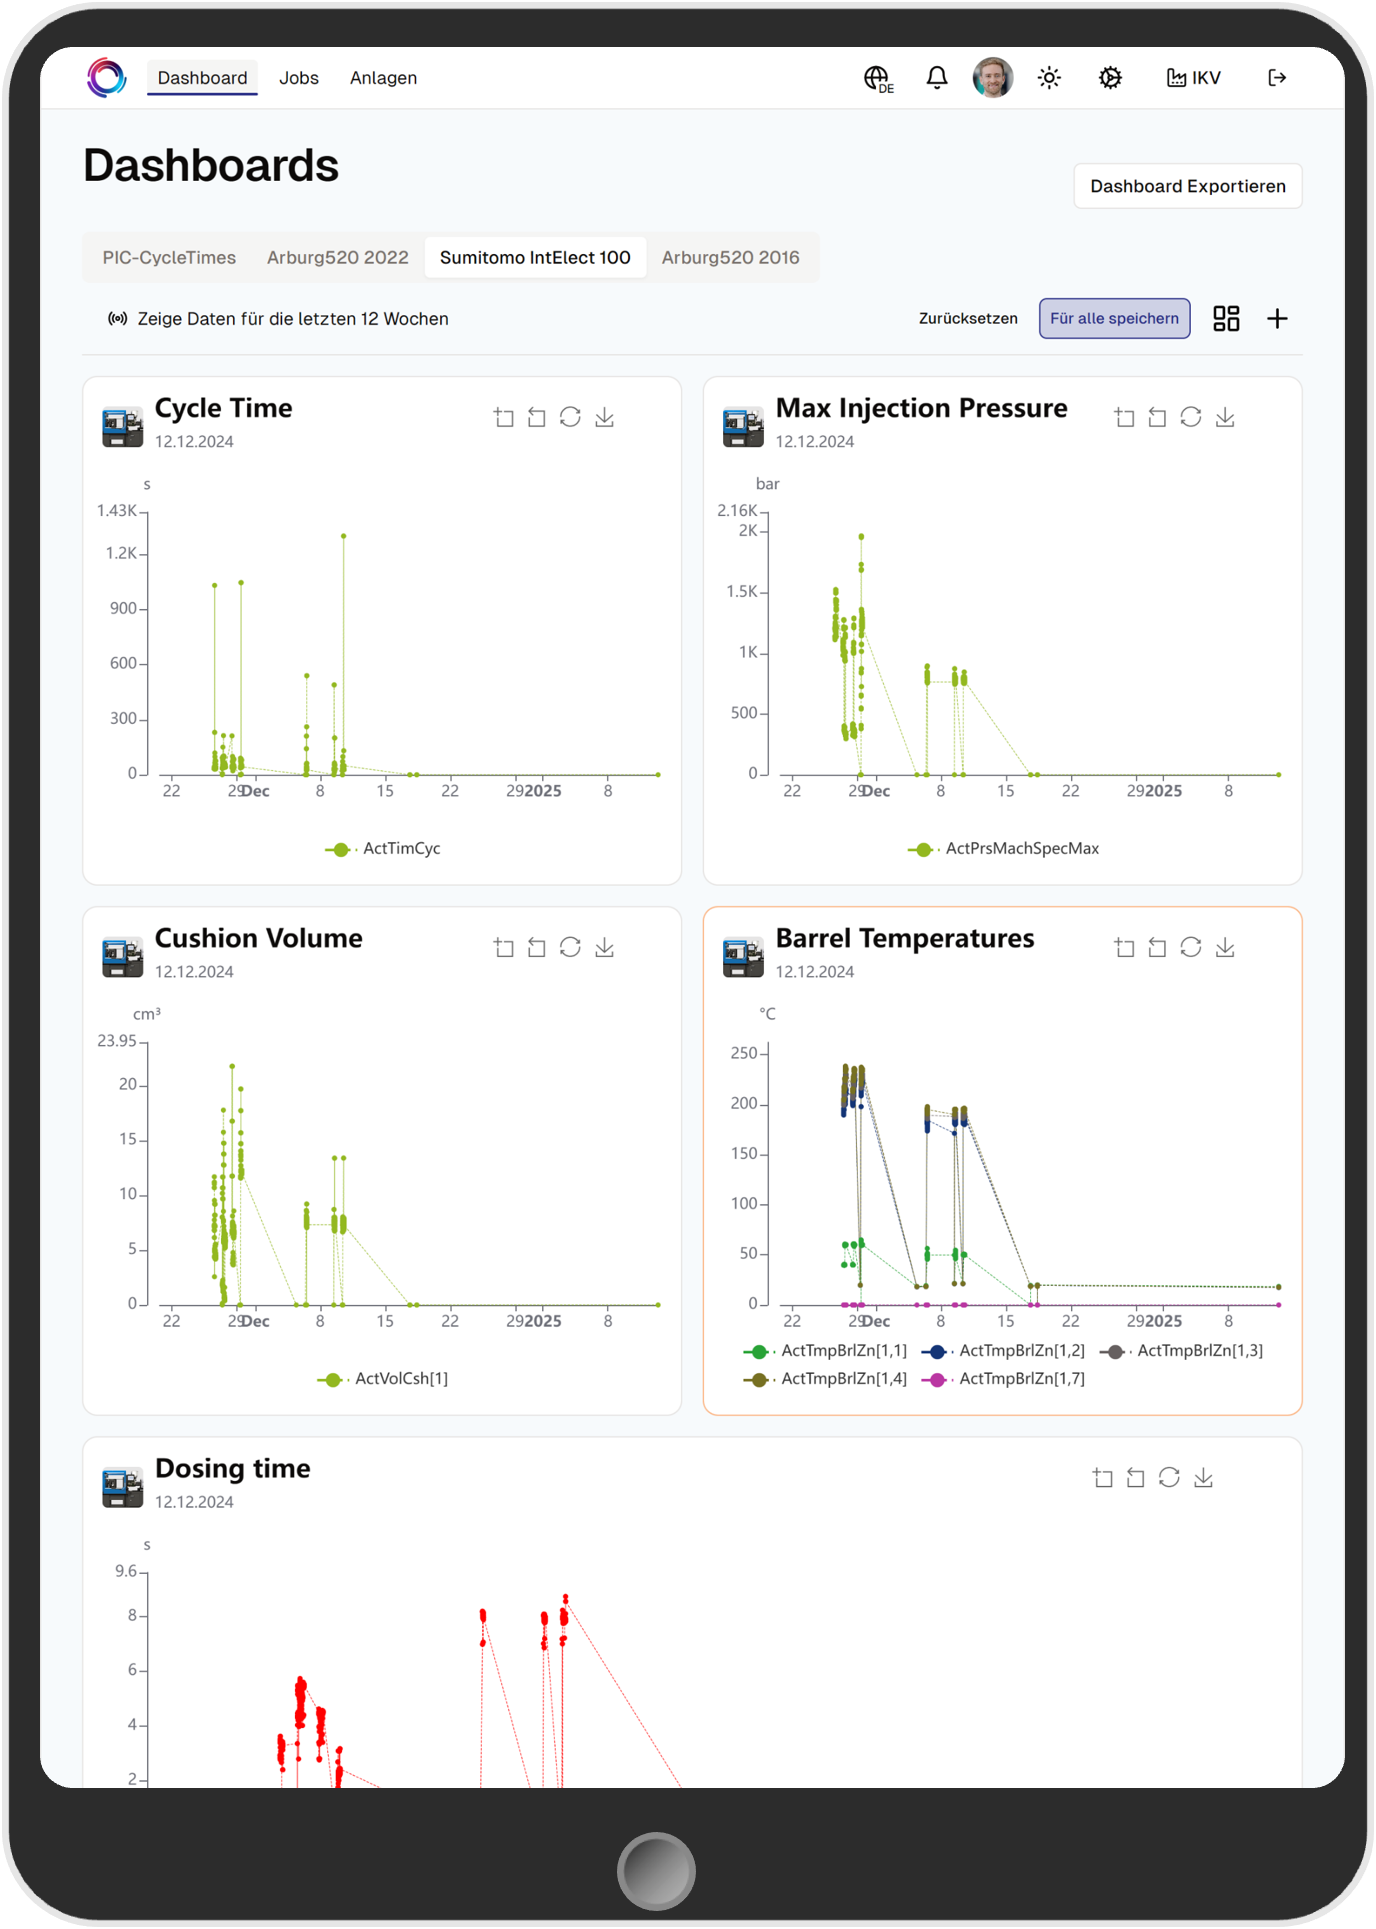
Fast access to your data – in real-time
Use as many process charts to display your data as requested.
✓ Access all stored data here
✓ Combine parameters and assets in view flexibly
✓ Real-time updates and user-specific views

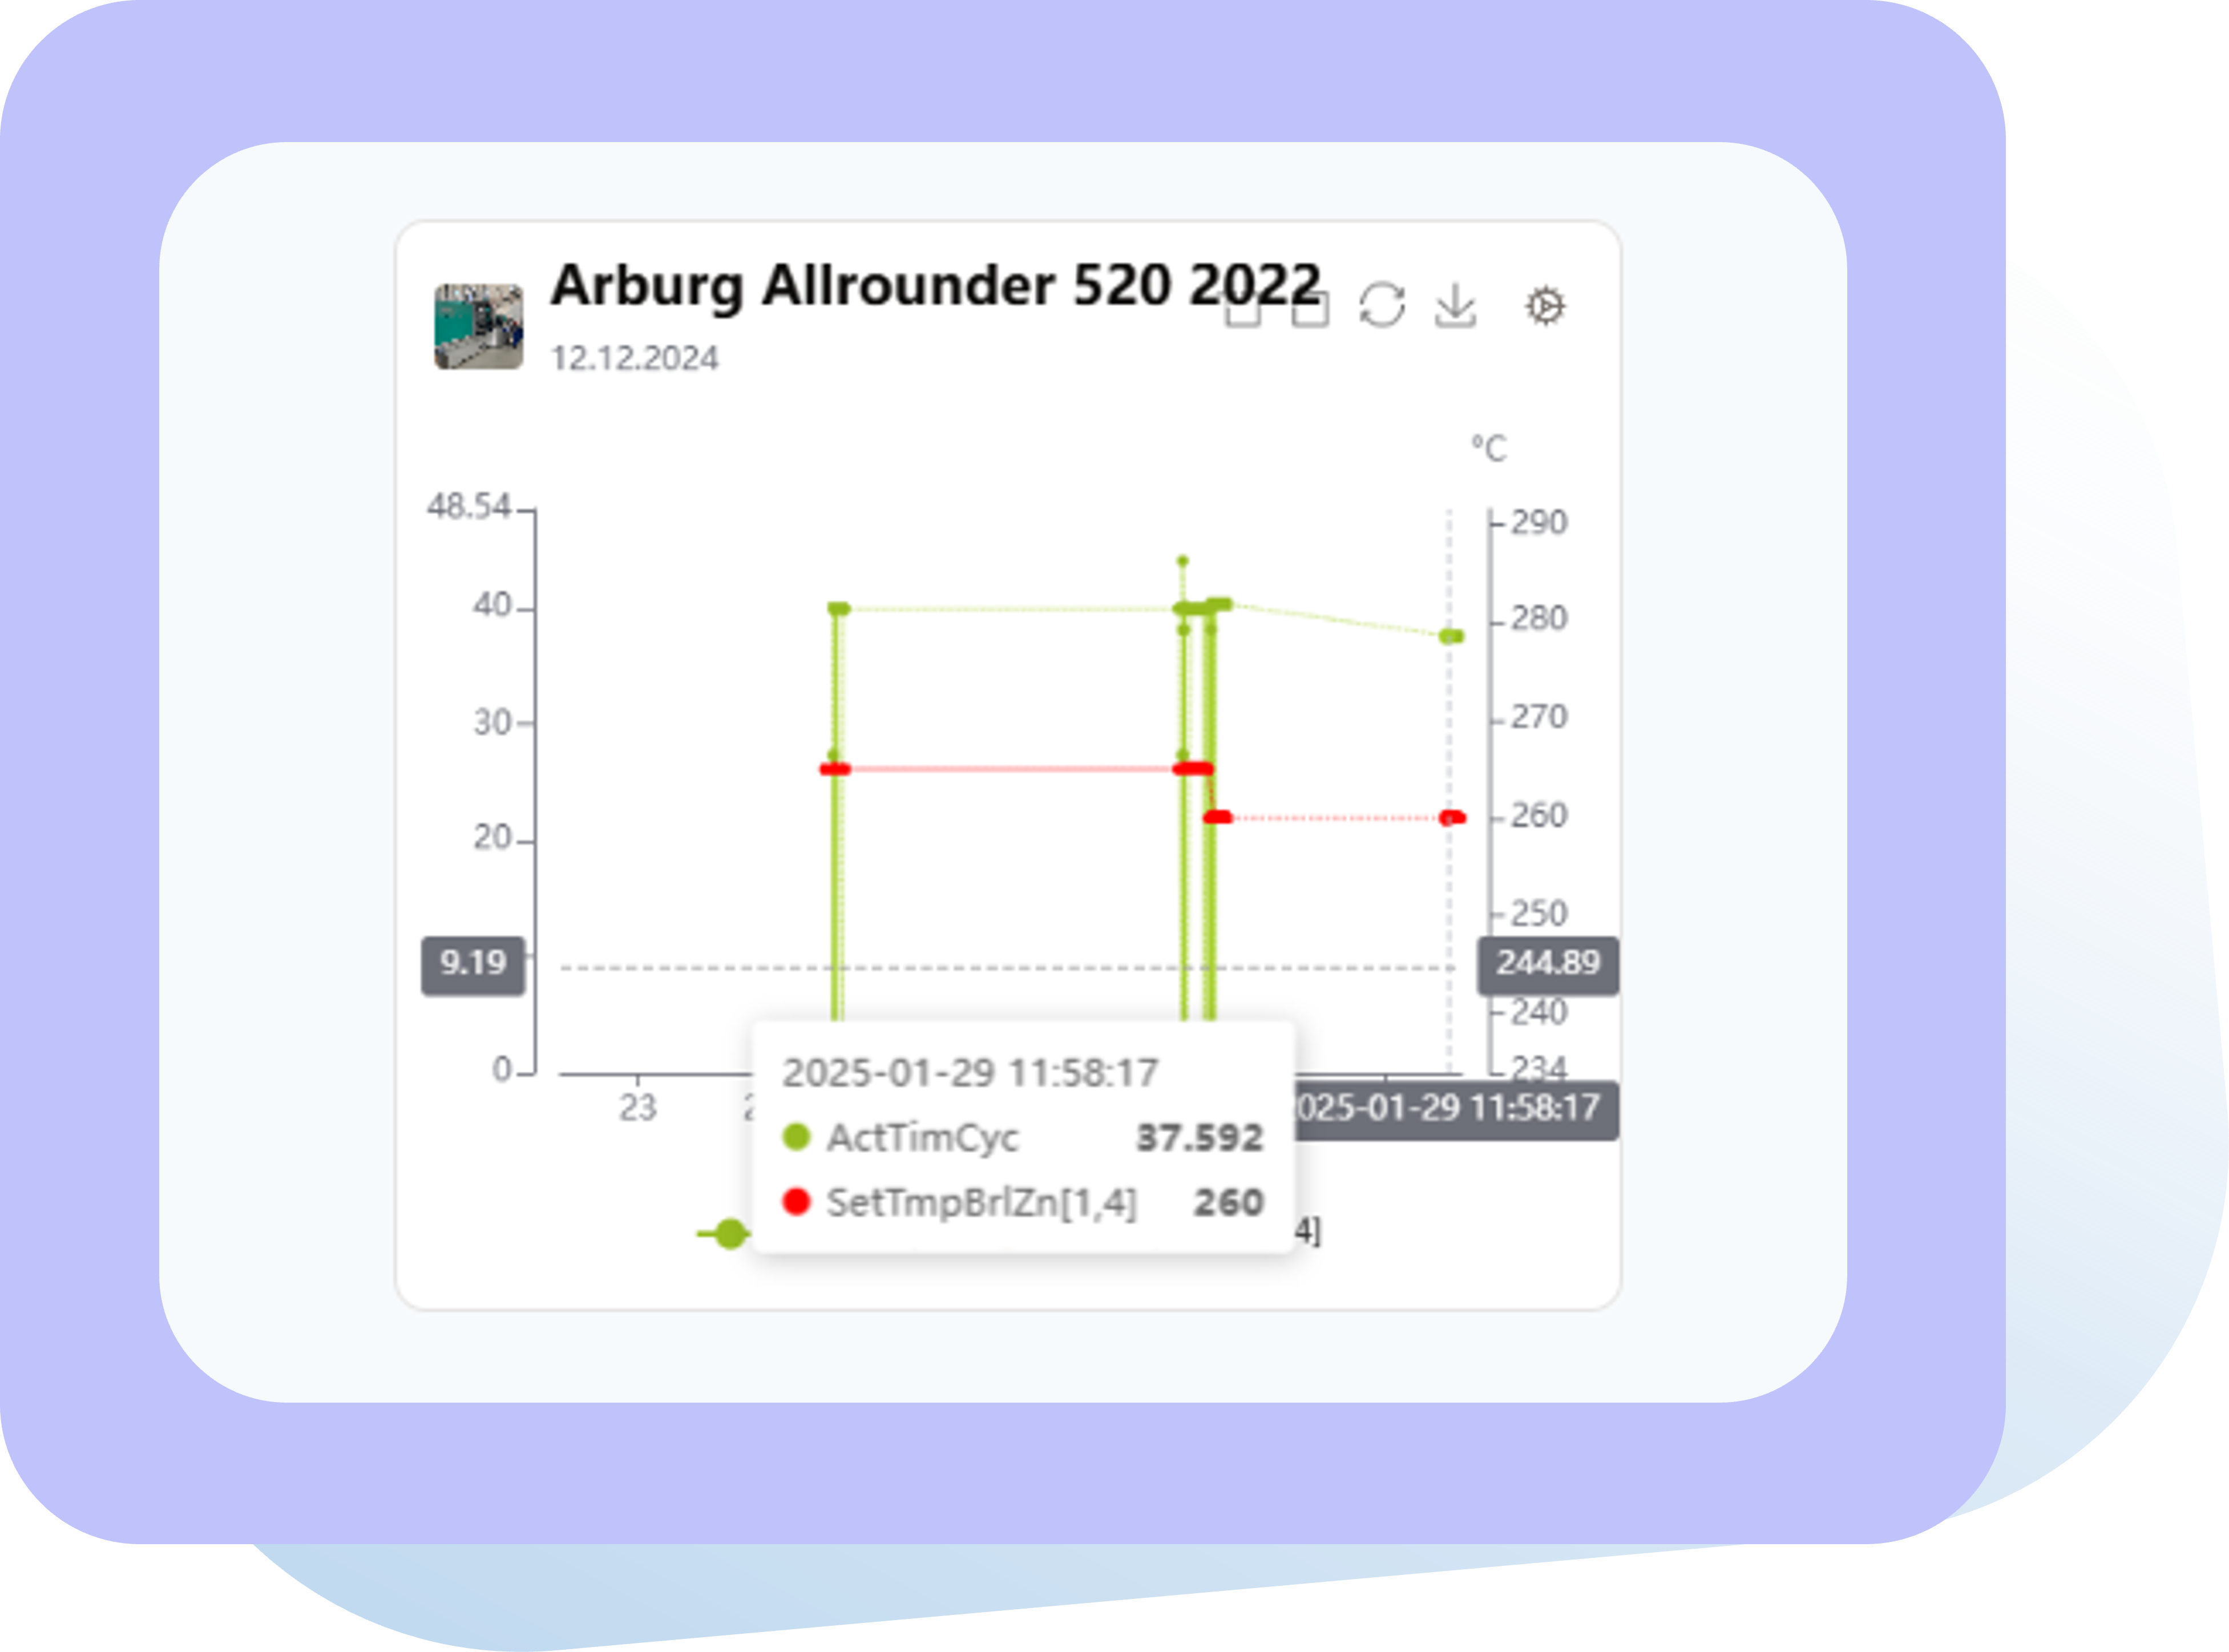
Use different views
Your dashboards are individual and you can design the elements in them as you like.
✓ Quickly use provided widgets
✓ Show charts, scalar values and much more
✓ Continued development of more widgets
FAQs
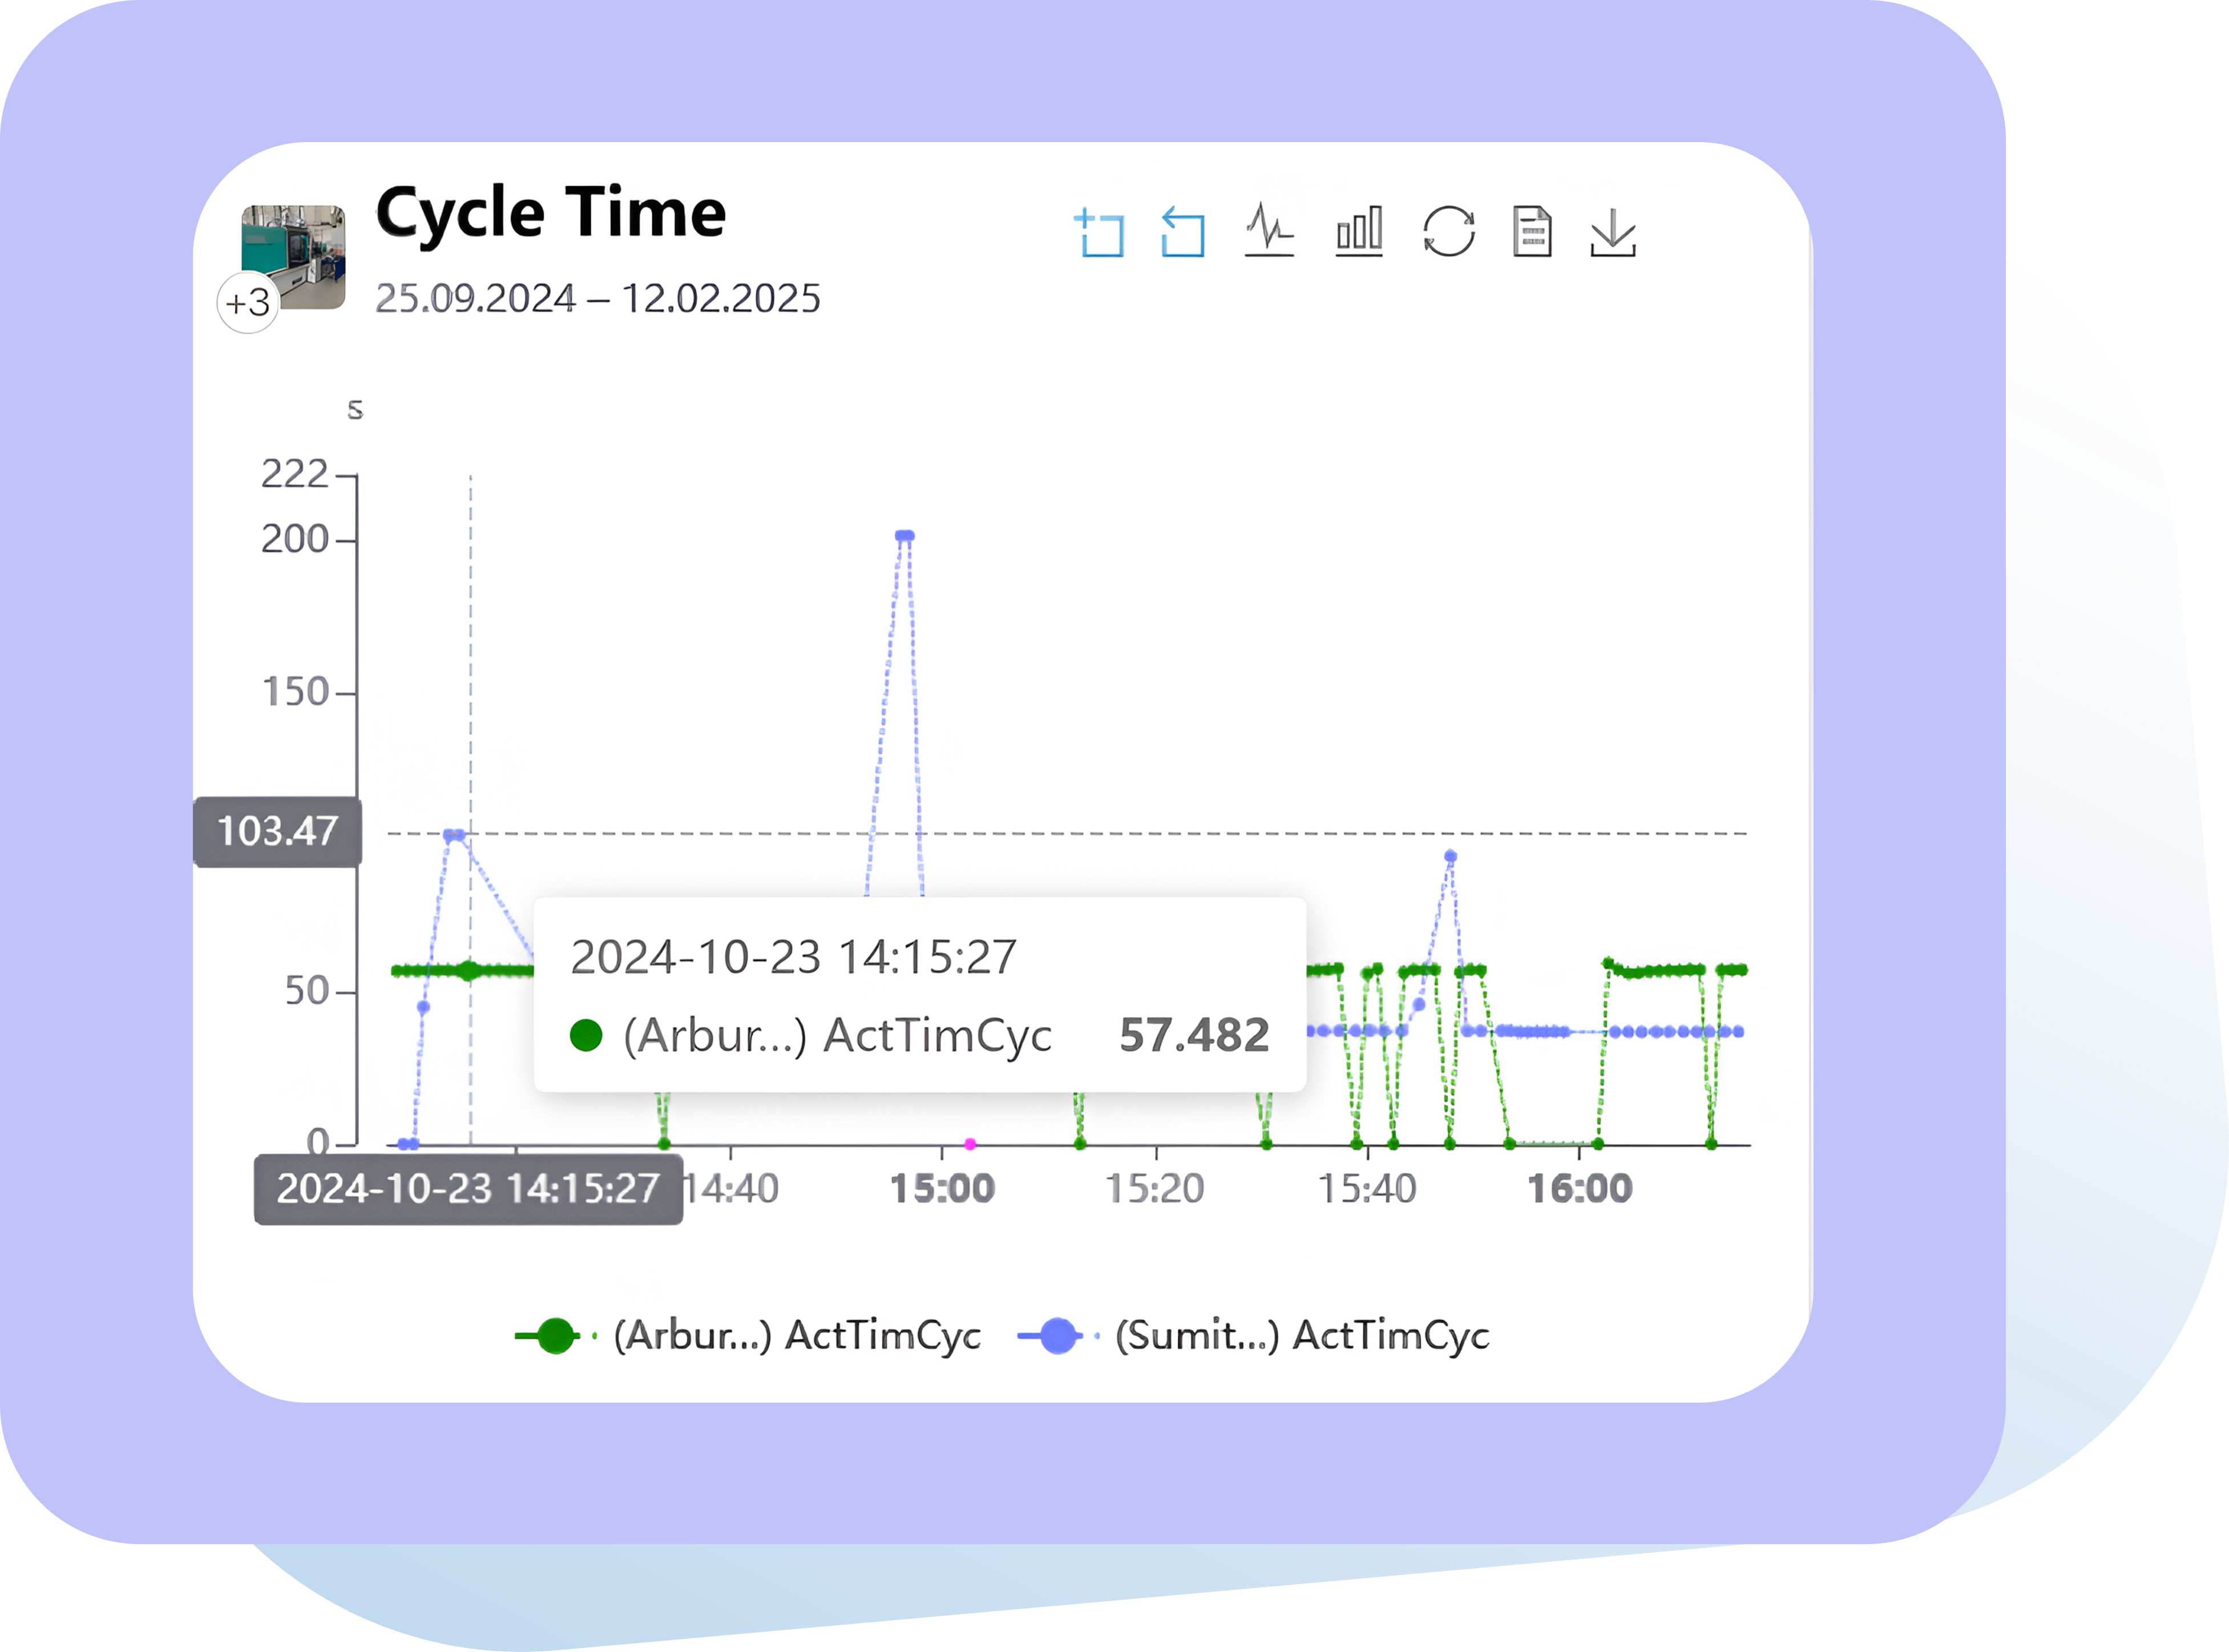
See all machines and individual parameters in the same tool
You can create as many dashboards as you need and focus on your specific interests
✓ Dashboards for shifts and responsees
✓ Show overviews or detailed process-specific data
✓ Visualize the status of each machine live
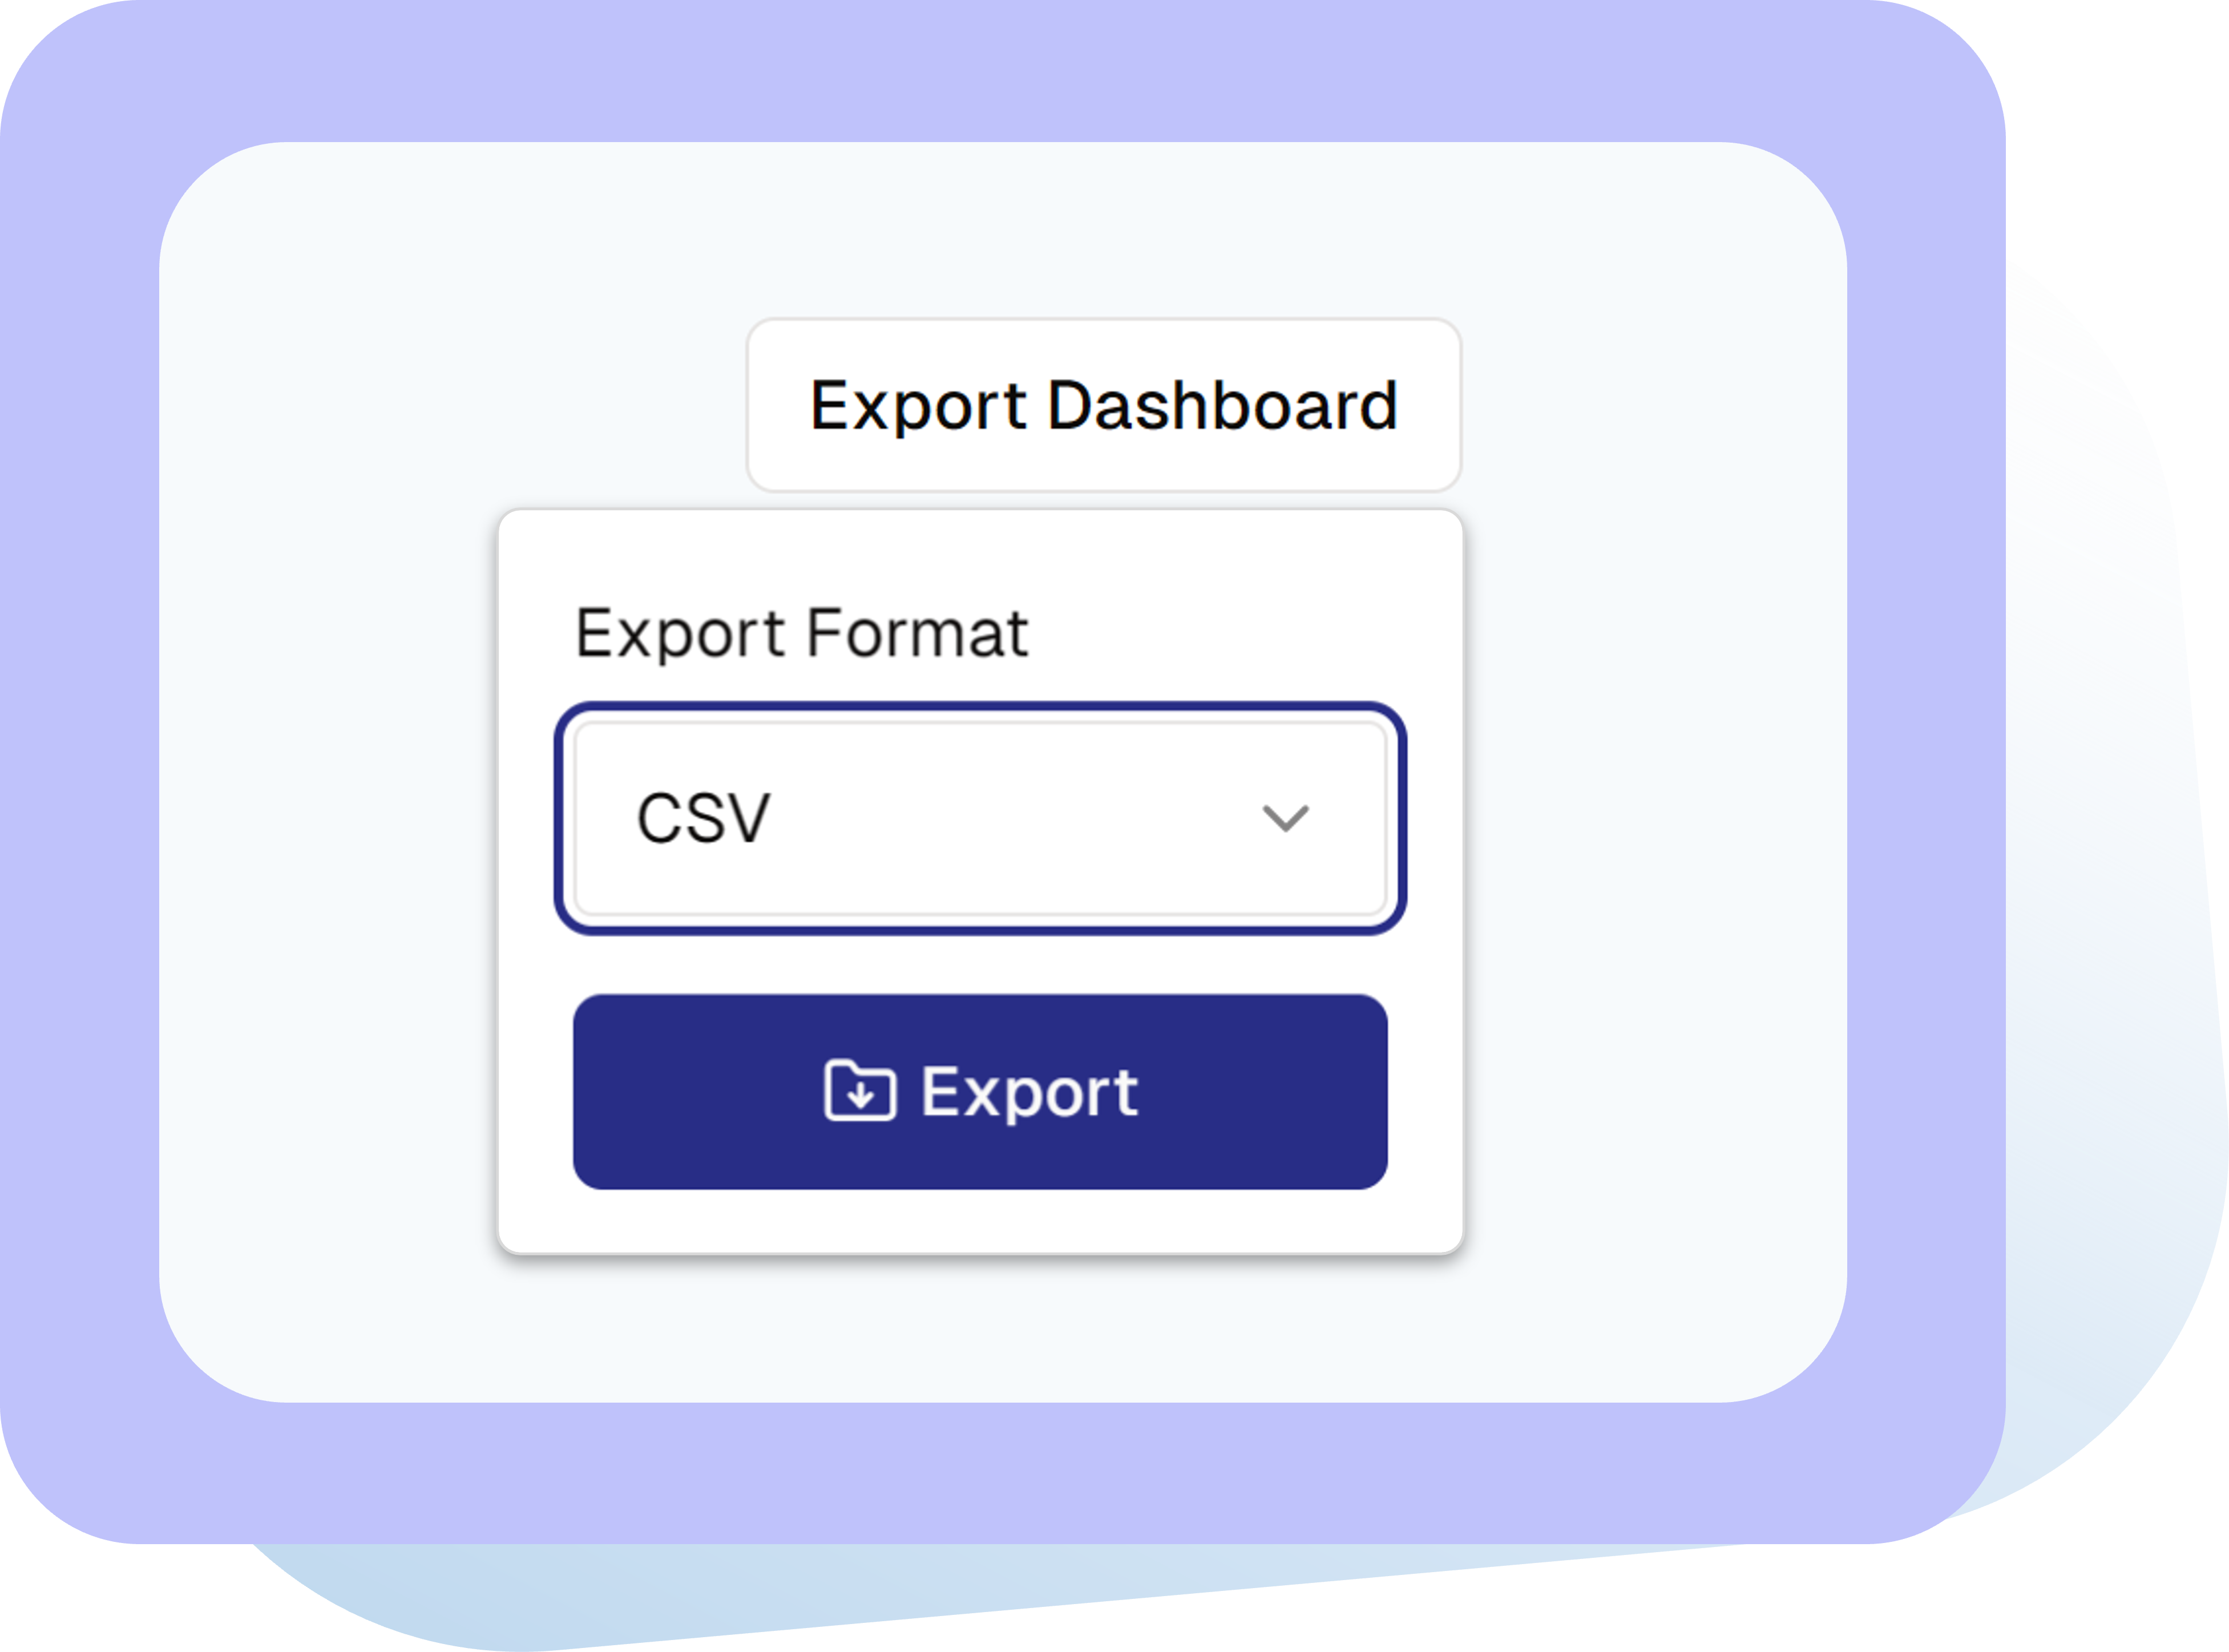
Export your dashboards
What you see is what you get! Export all the data from your dashboards in one click.
✓ Common data formats
✓ Immediately process you data elsewhere
✓ Fuel analysis like 8D reports
Become an Expert

Already use a MES? – Where OSPHIM Complements it!

Making Data Smarter with Semantics in Injection Molding
Participation of OSPHIM@Haitian Open House 2024
Is my production ready?
Get in touch with us and find out in as much as 20min how to get OSPHIM up and running at your plant!