We Understand Your Challenges: Overcoming Unique Obstacles with Innovation and Expertise
Get in touch
Ready to take your production to the next level?

Optimal Process Settings?
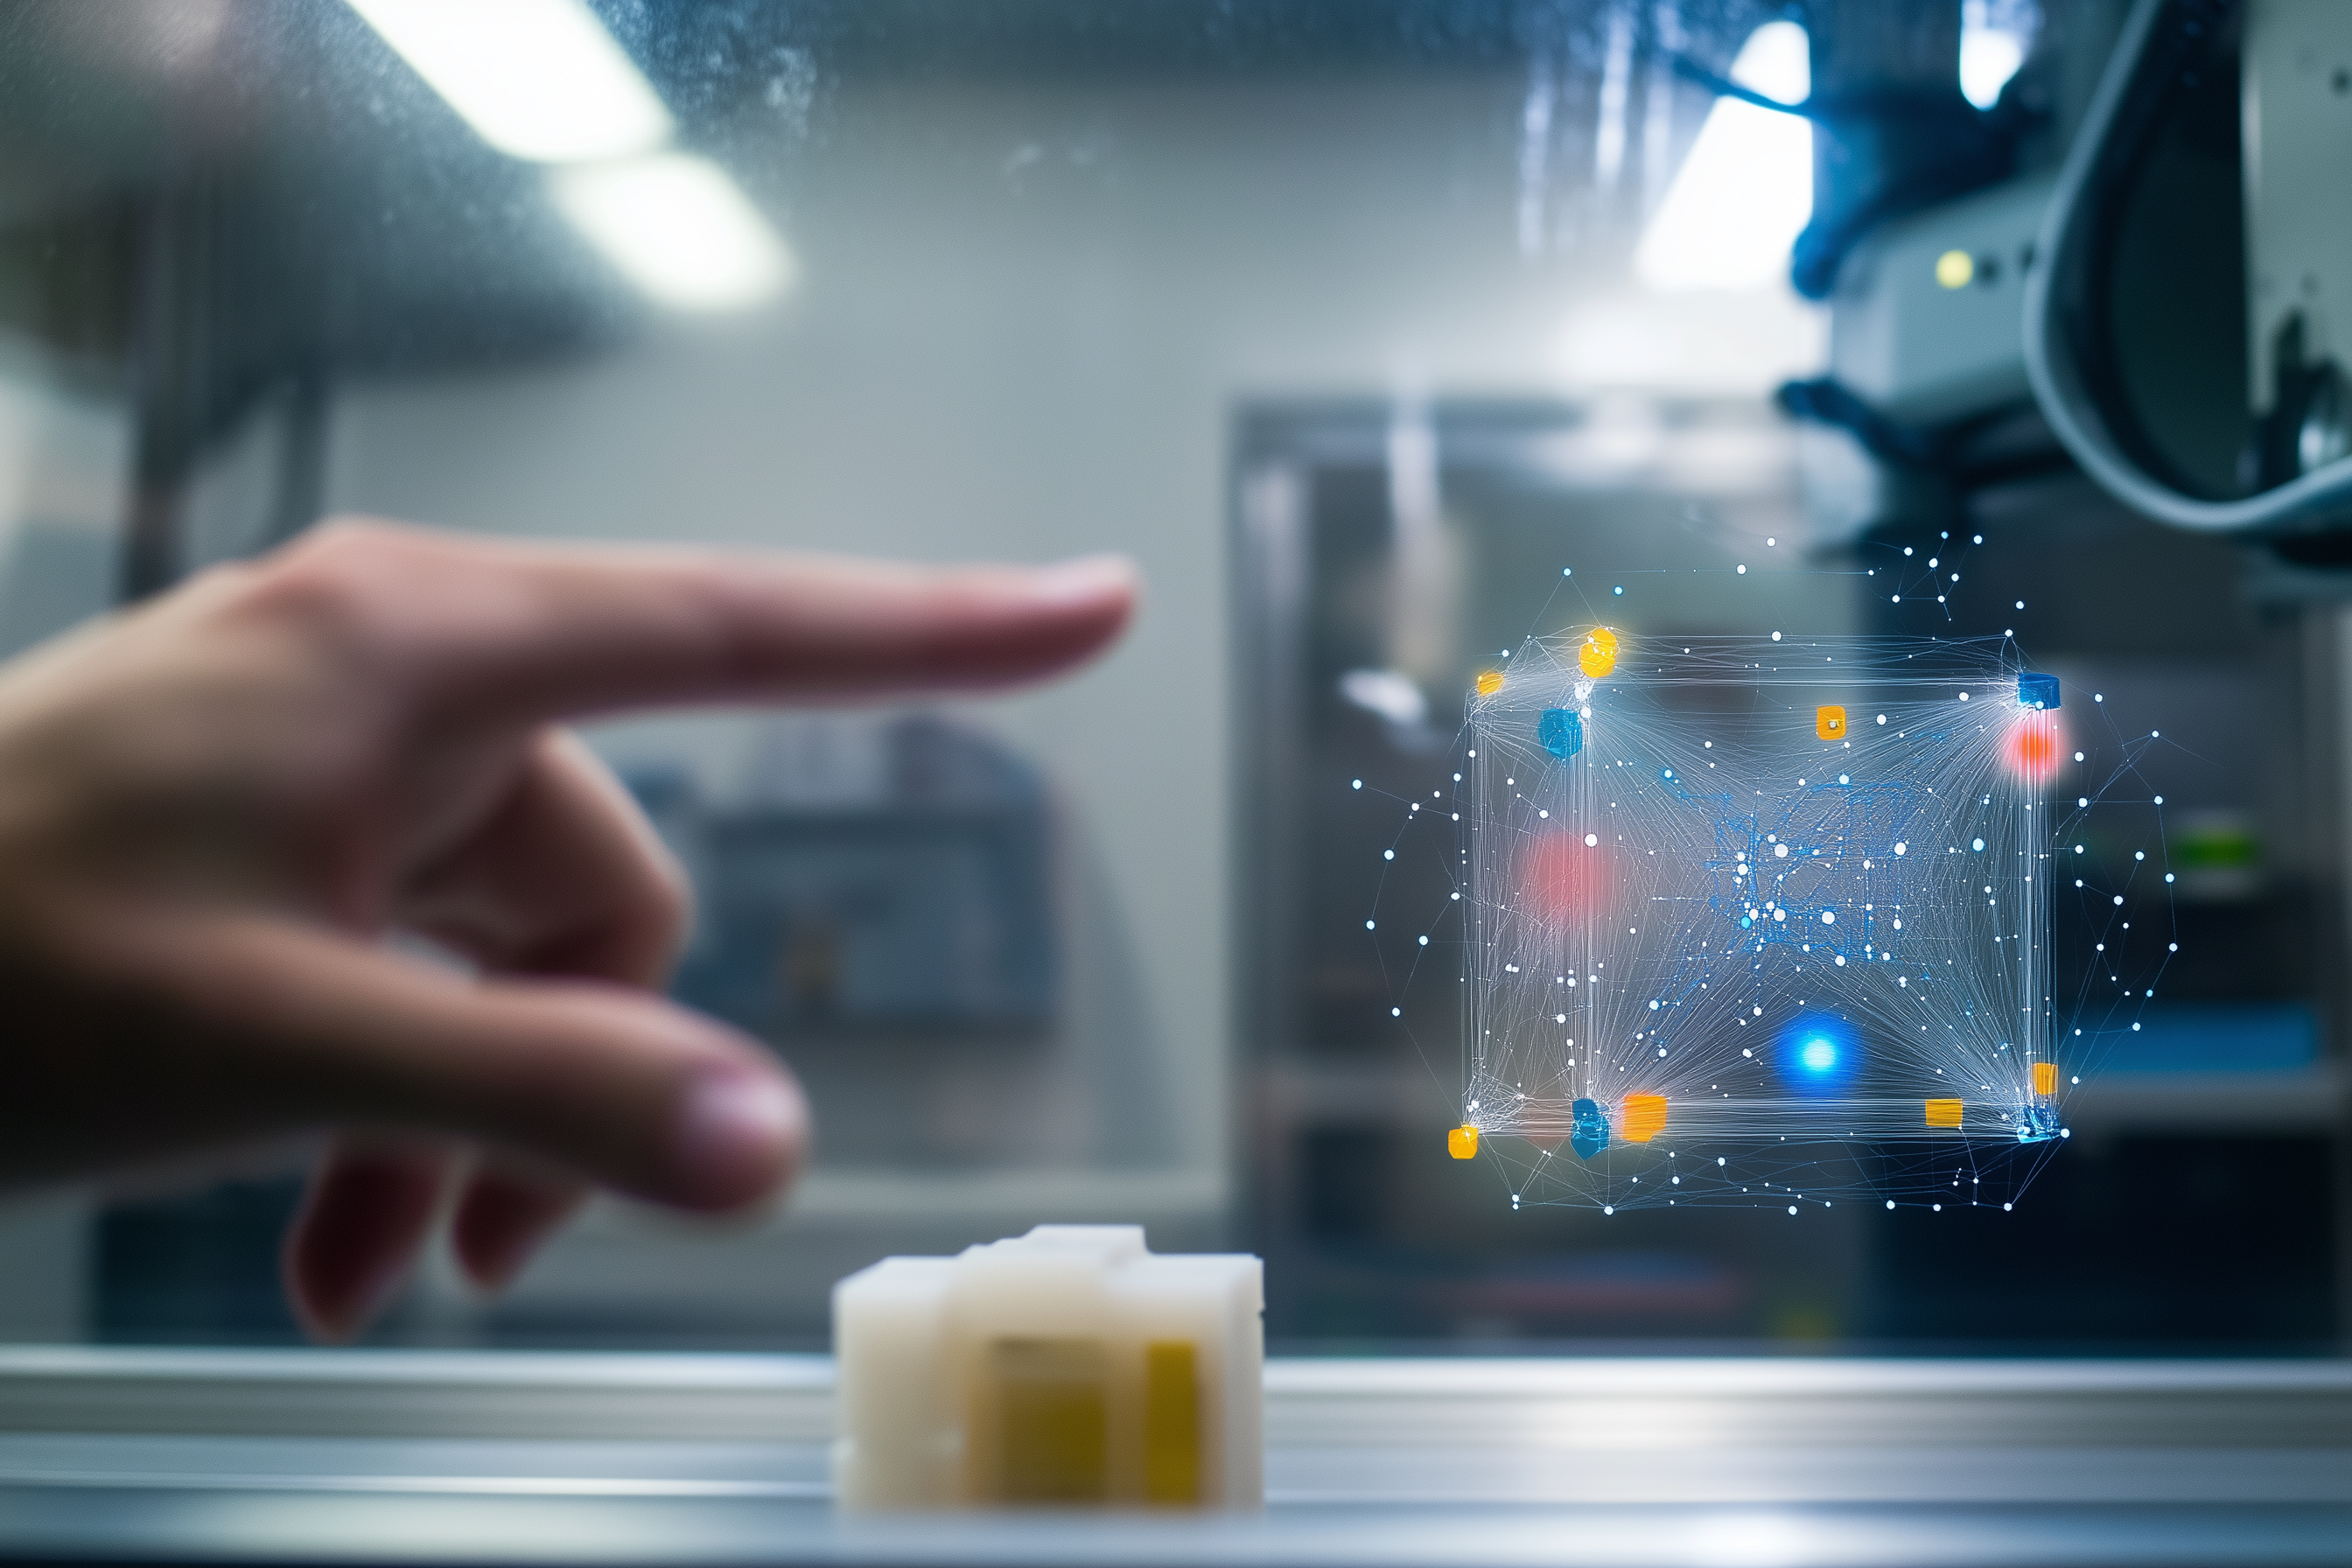
Precise mold characterization and process analysis are essential for optimizing injection molding processes. With OSPHIM-WEB, you can collect structured process and quality data through guided sampling, using either your own test settings or those recommended by OSPHIM. By training an AI-powered process model, you can quickly optimize settings for low cycle times and high product quality.
Can you observe all your machine simultaneously?
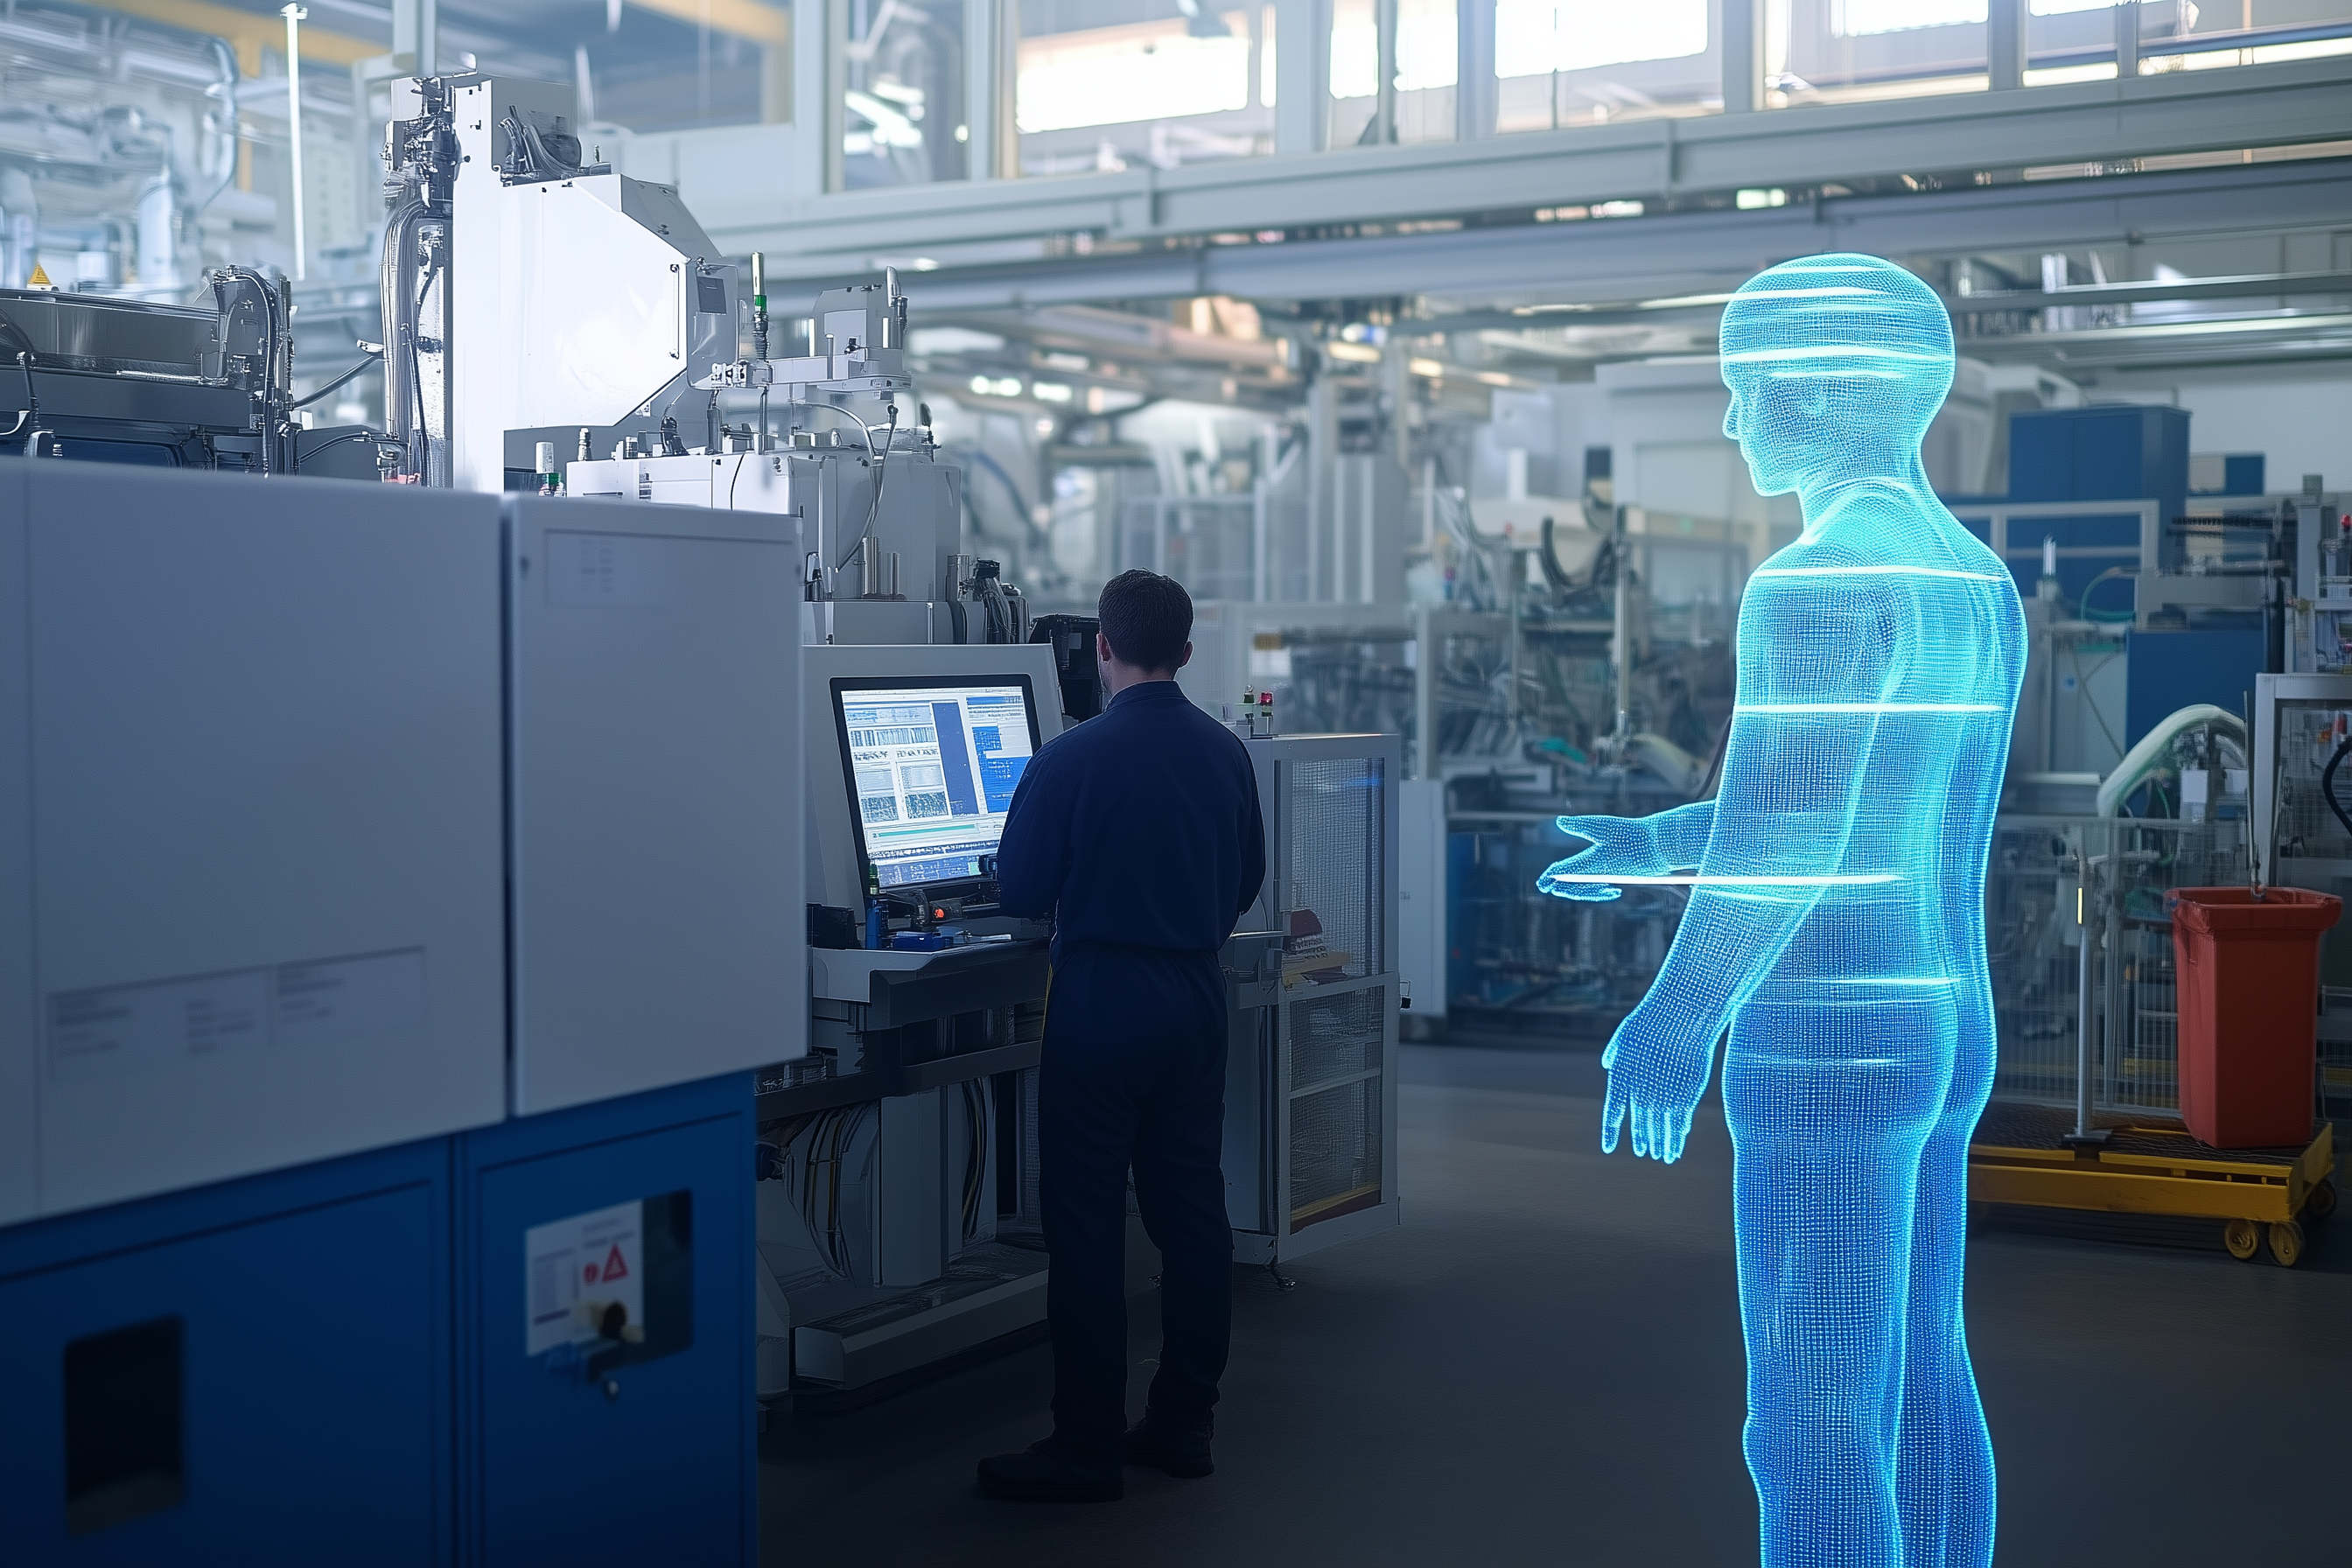
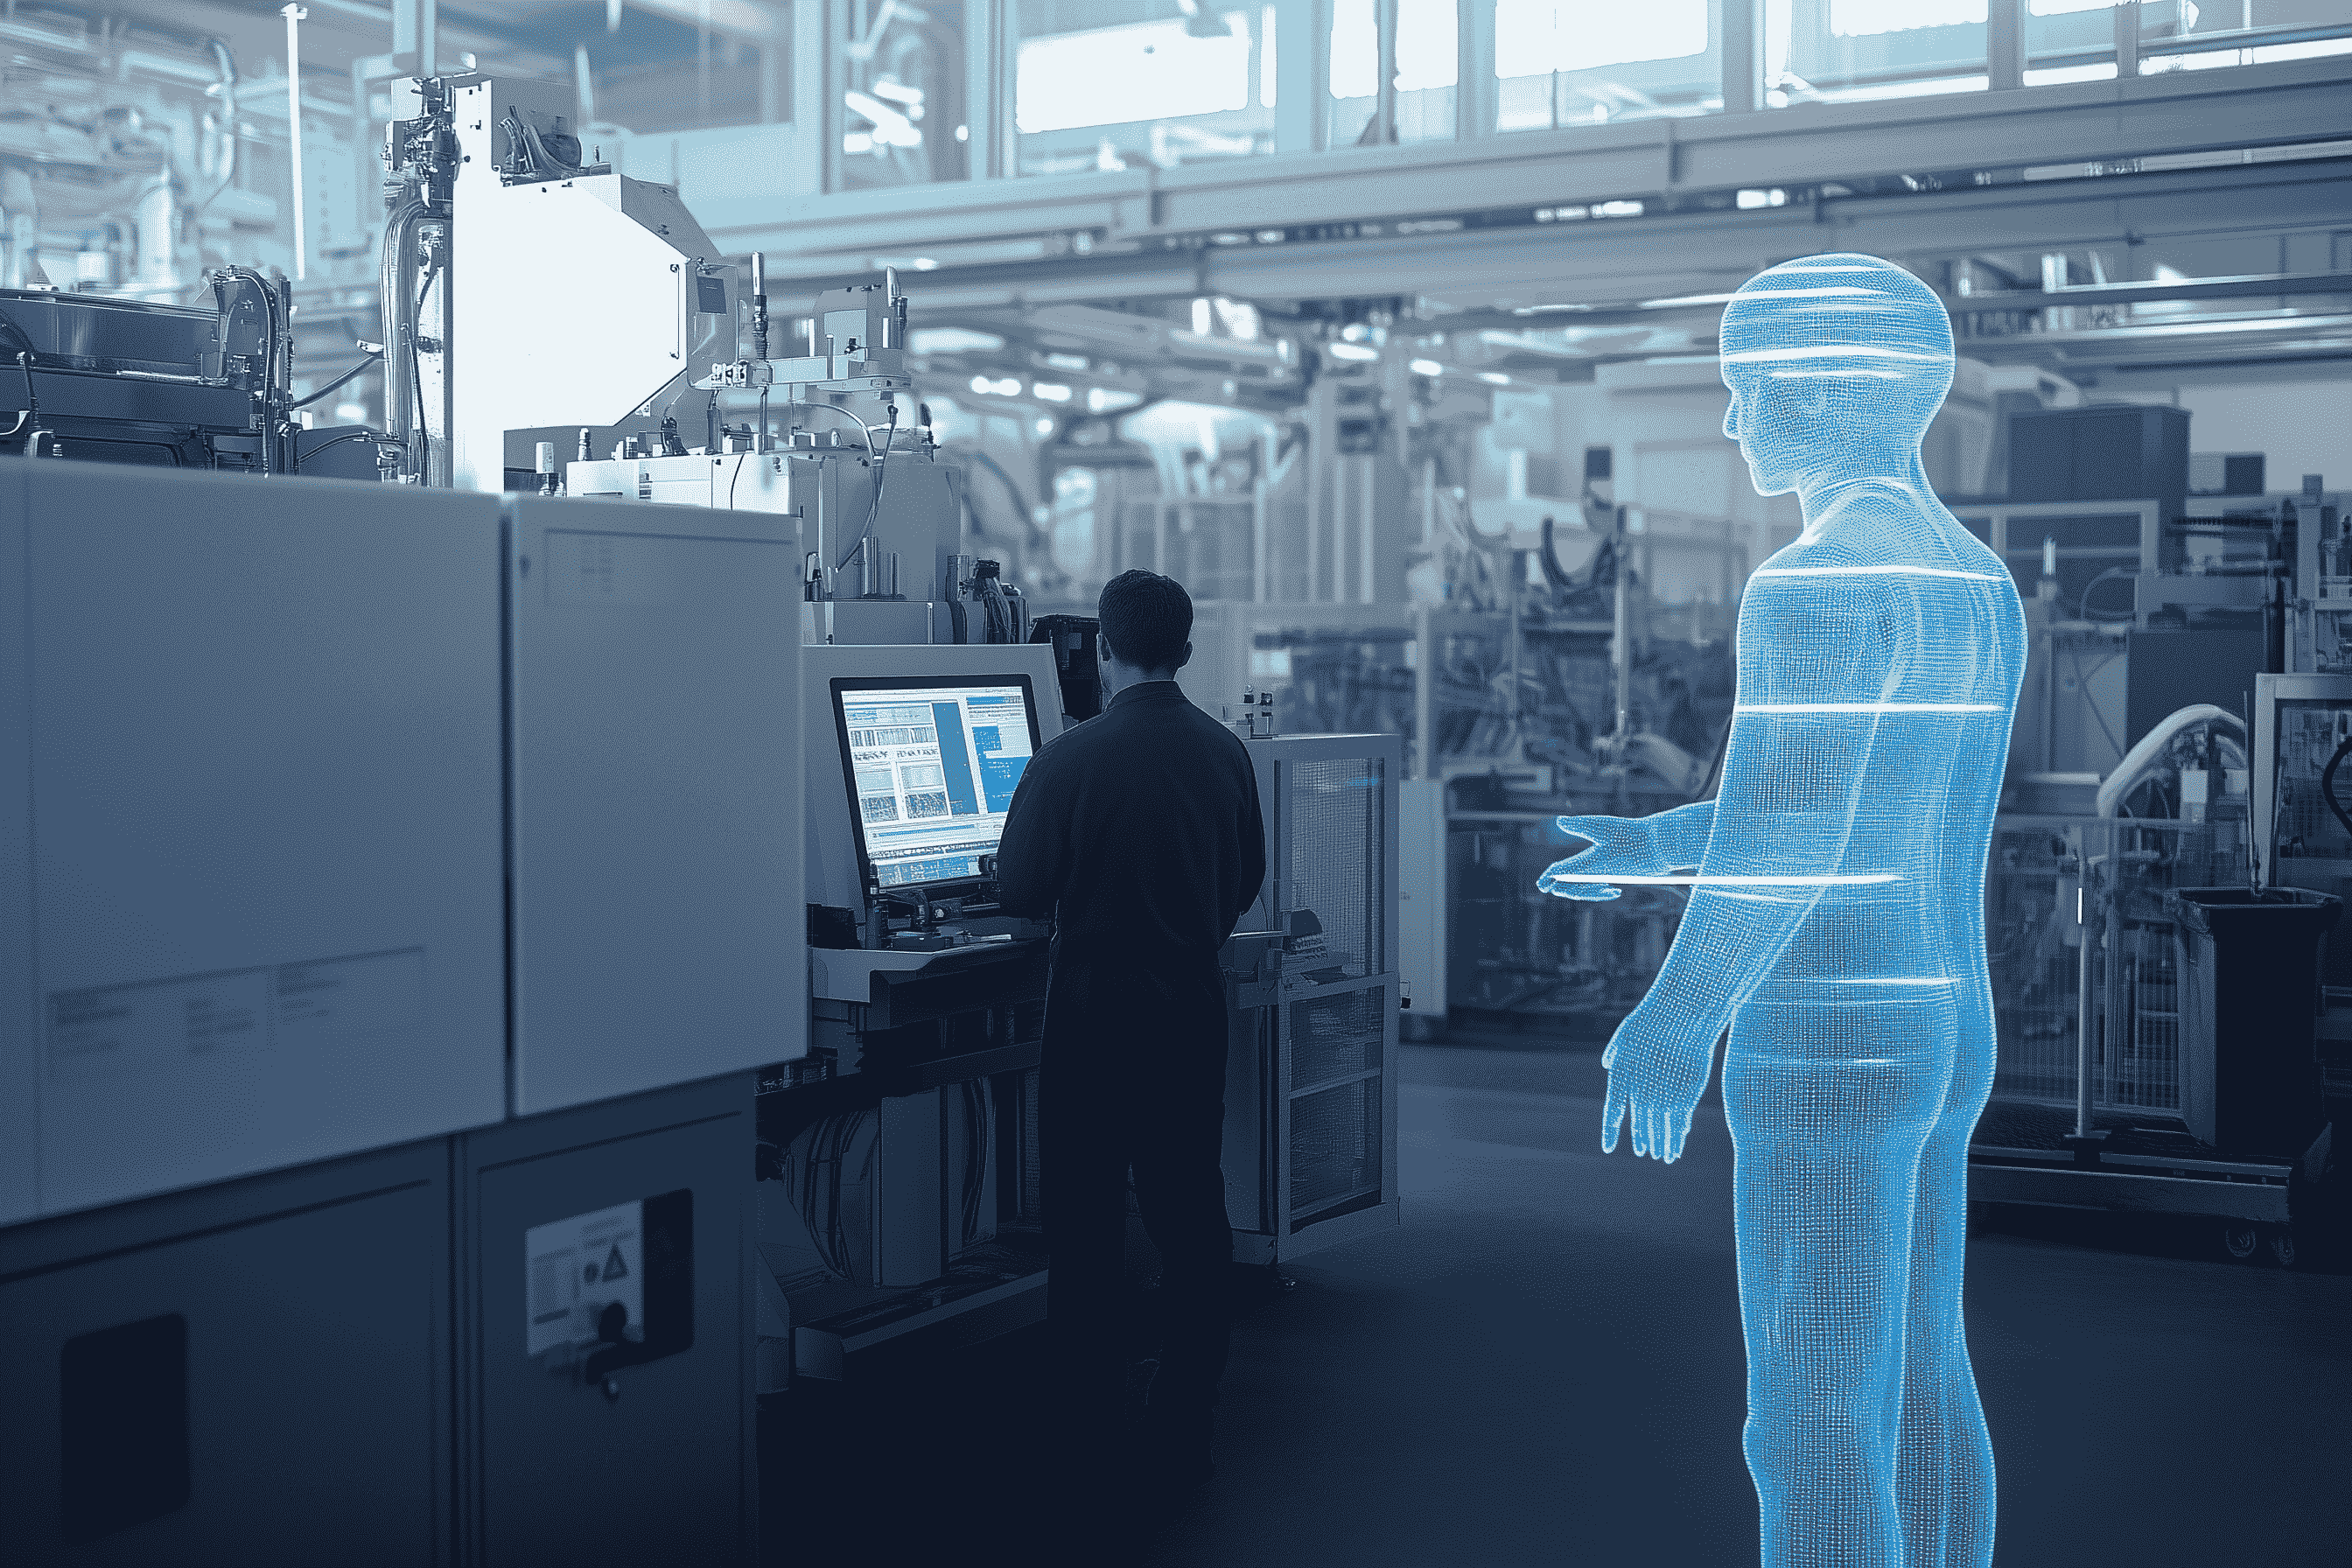
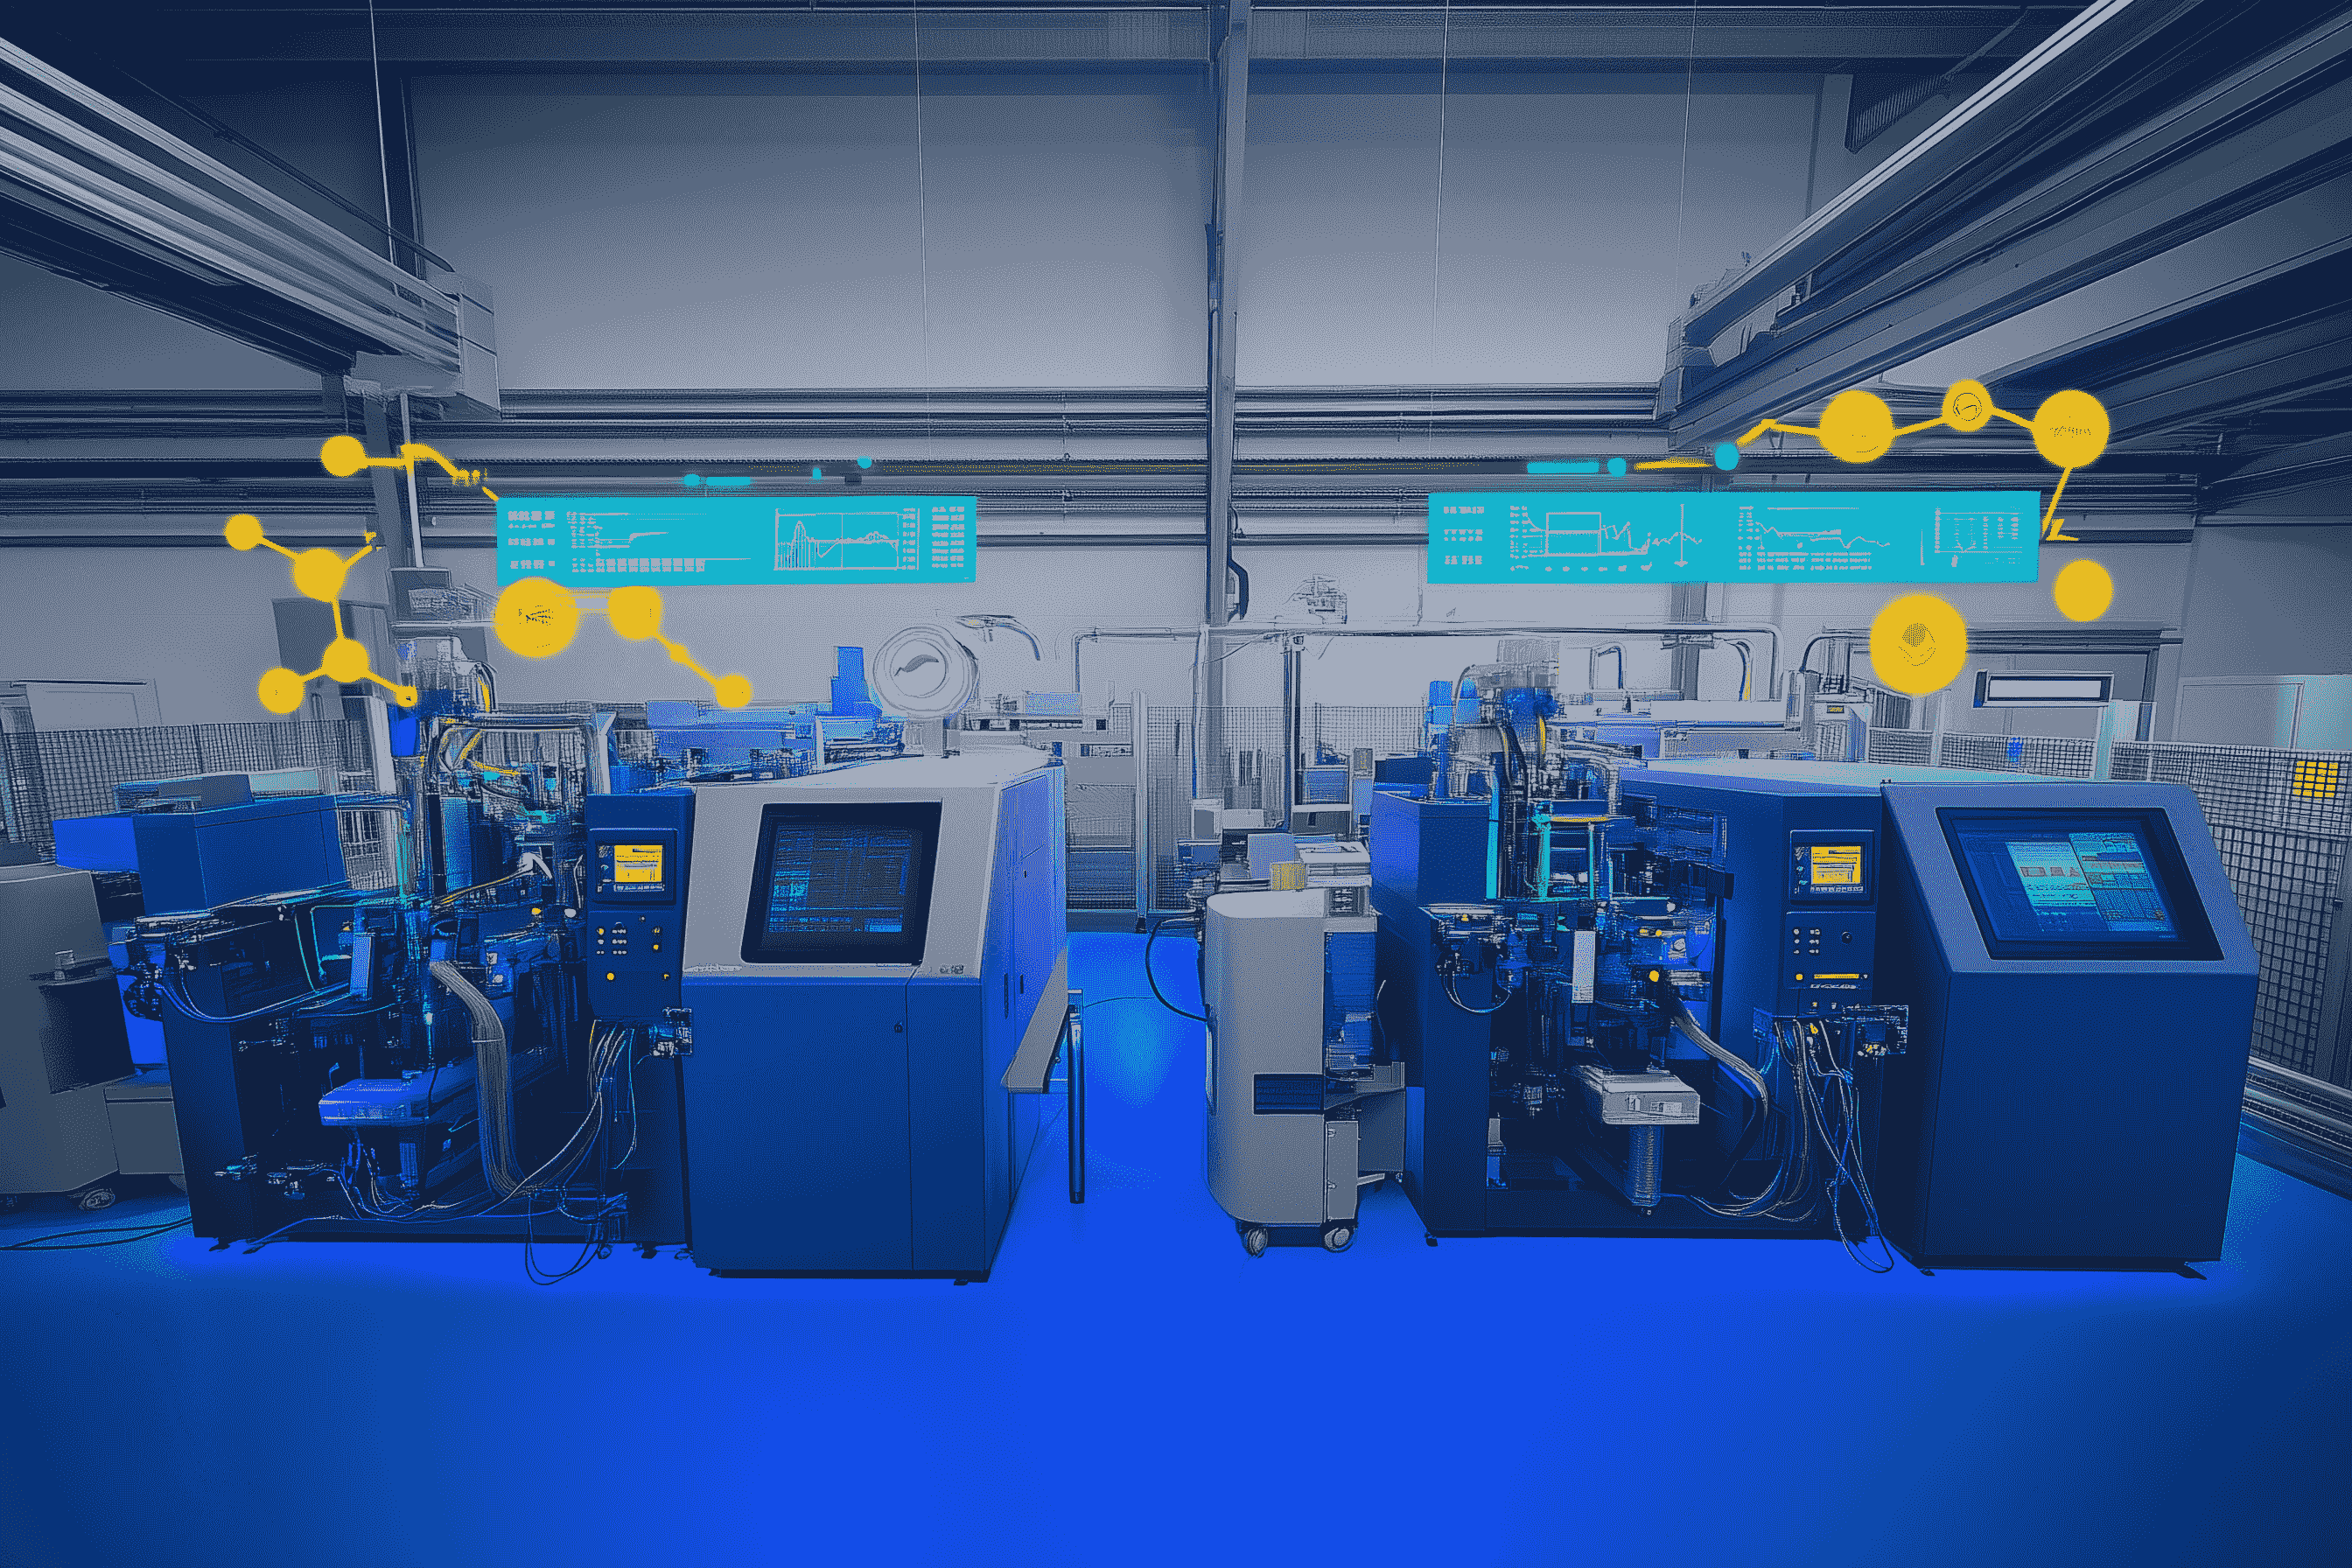
Injection molding processes are subject to quality fluctuations, giving need to monitor key process parameters and relevant KPIs. With customizable dashboards you can track performance in real-time. Our anomaly detection feature automatically identifies process deviations, keeping you informed with instant notifications in case of production variances.
Make your data available
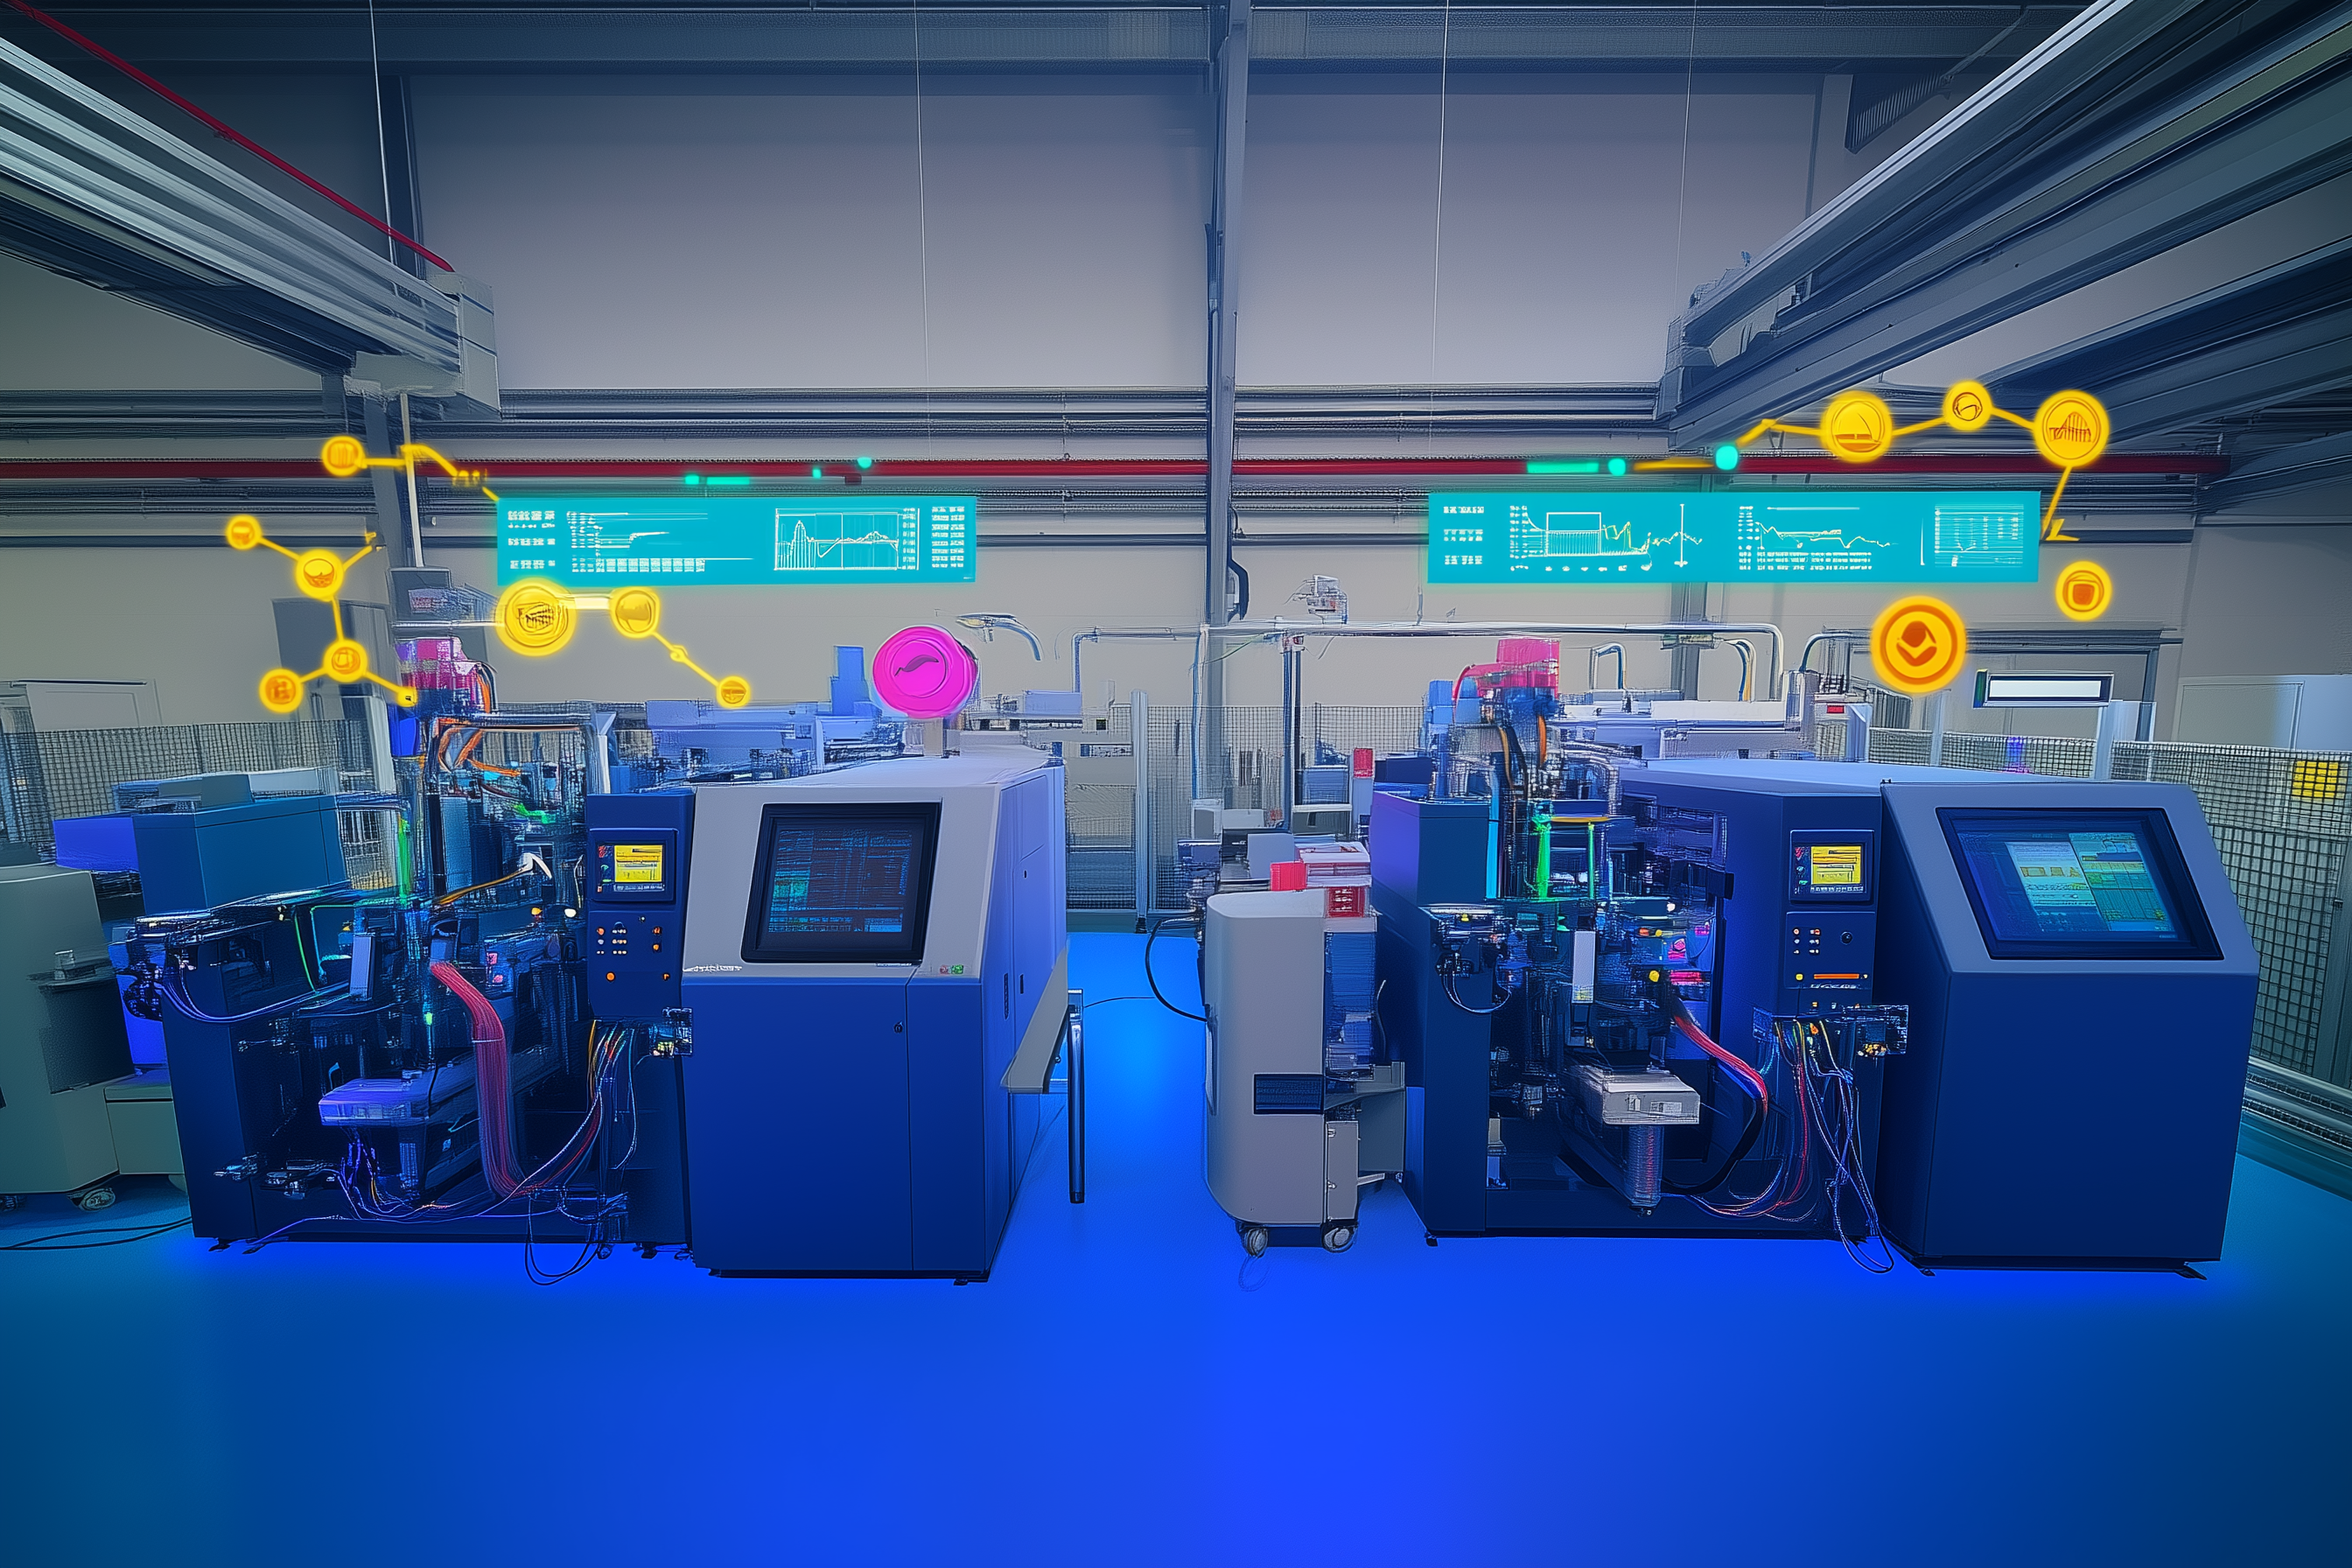
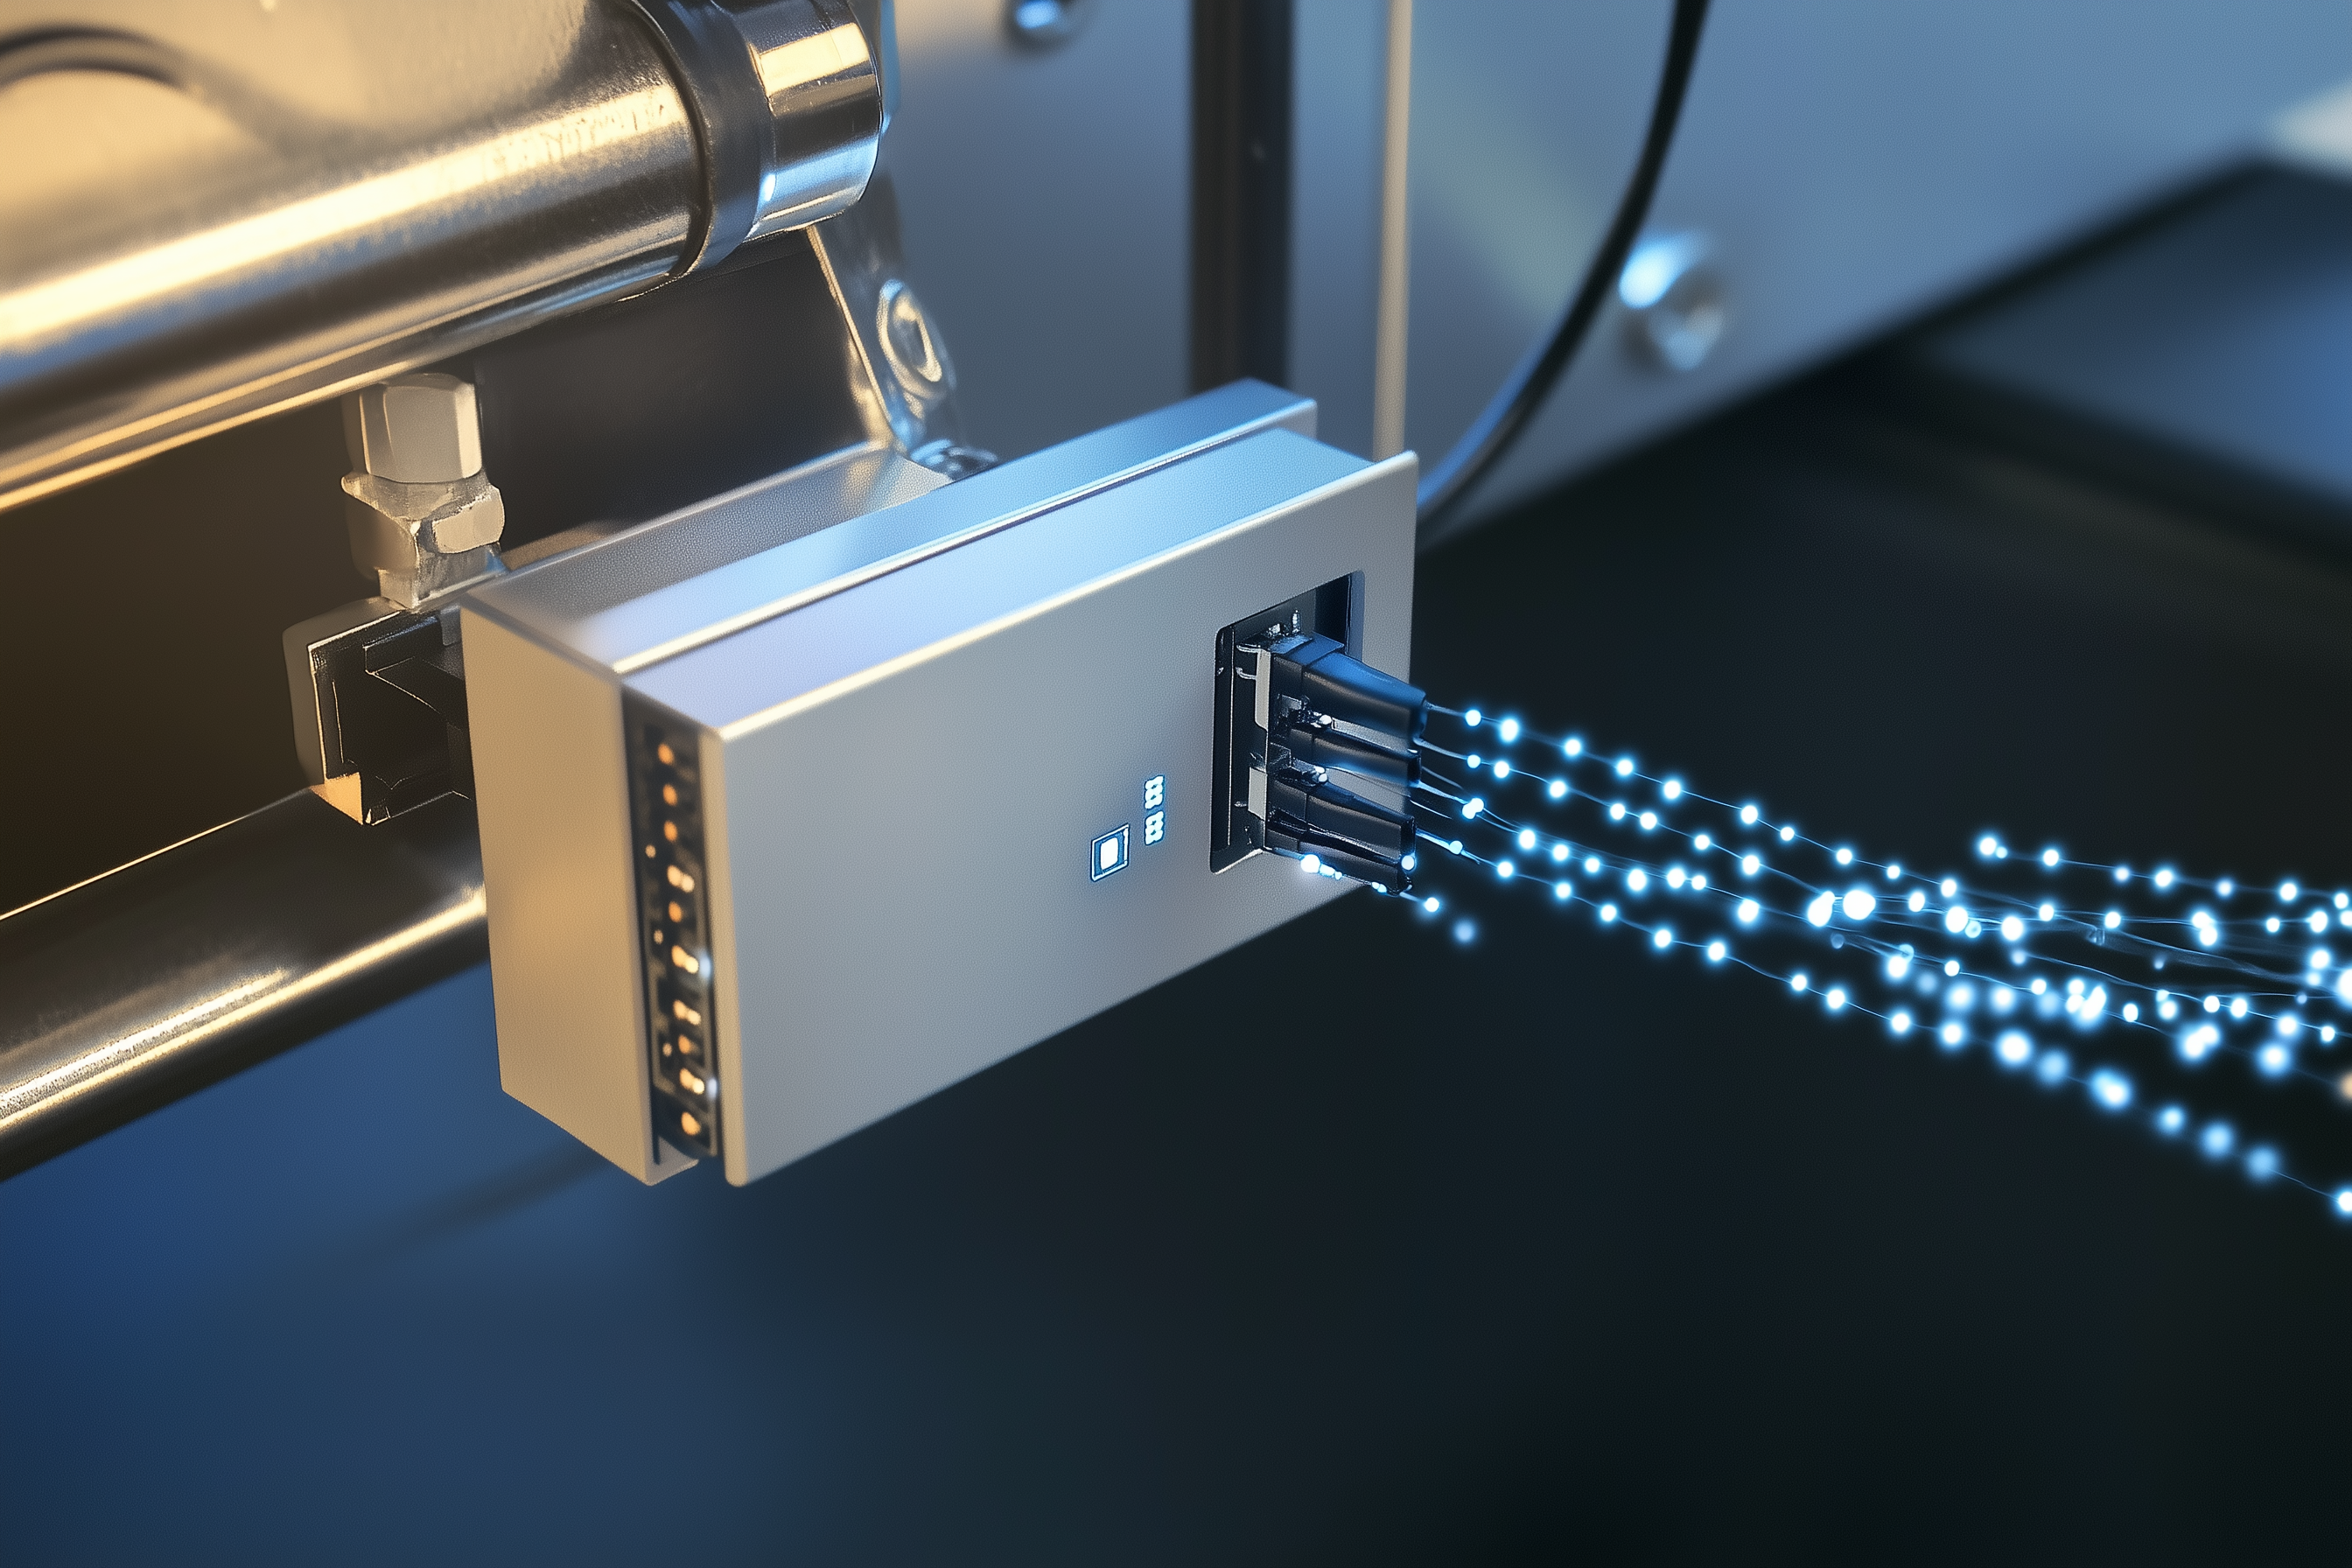
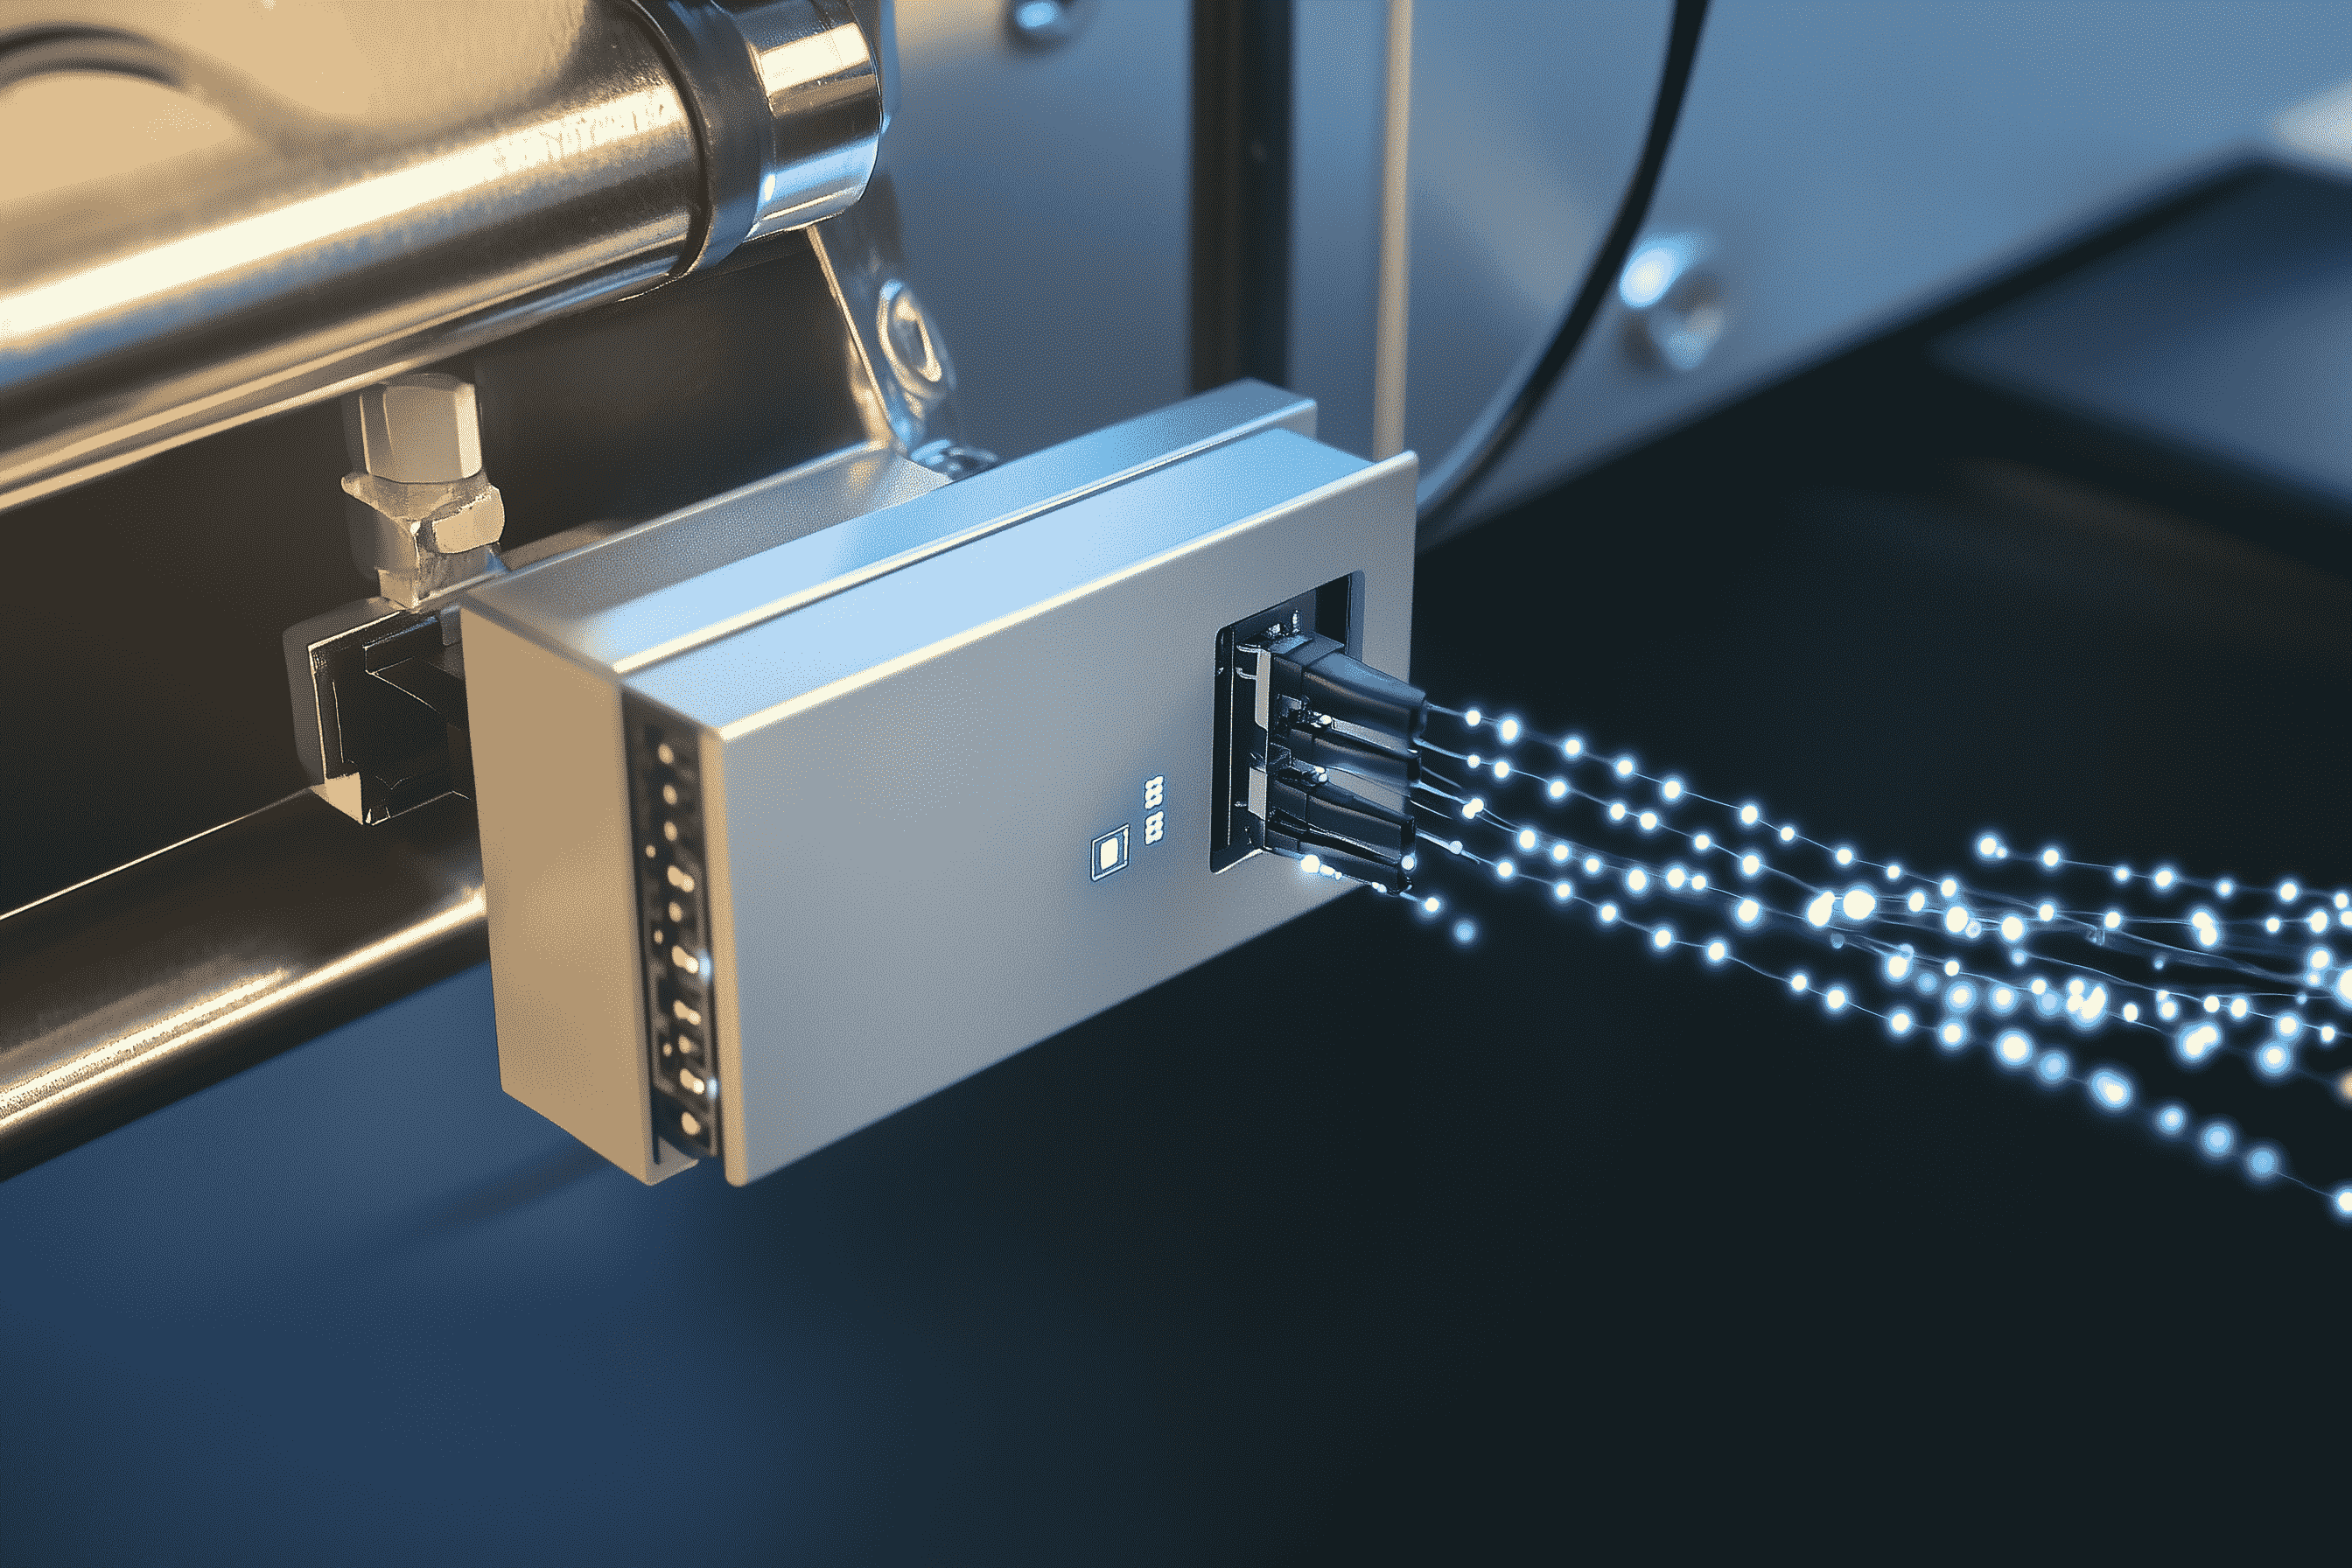
Unused machine data in production can offer valuable insights for process optimization. With the OSPHIM BOX, you can easily connect your machines and peripheral devices to capture and store process data. It supports both ethernet-based interfaces (e.g., OPC-UA, Euromap 63) and local interfaces (e.g., RS 485), allowing you to synchronize data from all involved systems, such as injection molding machines, temperature controllers, and cameras, for comprehensive process analysis.
Track everything remotely
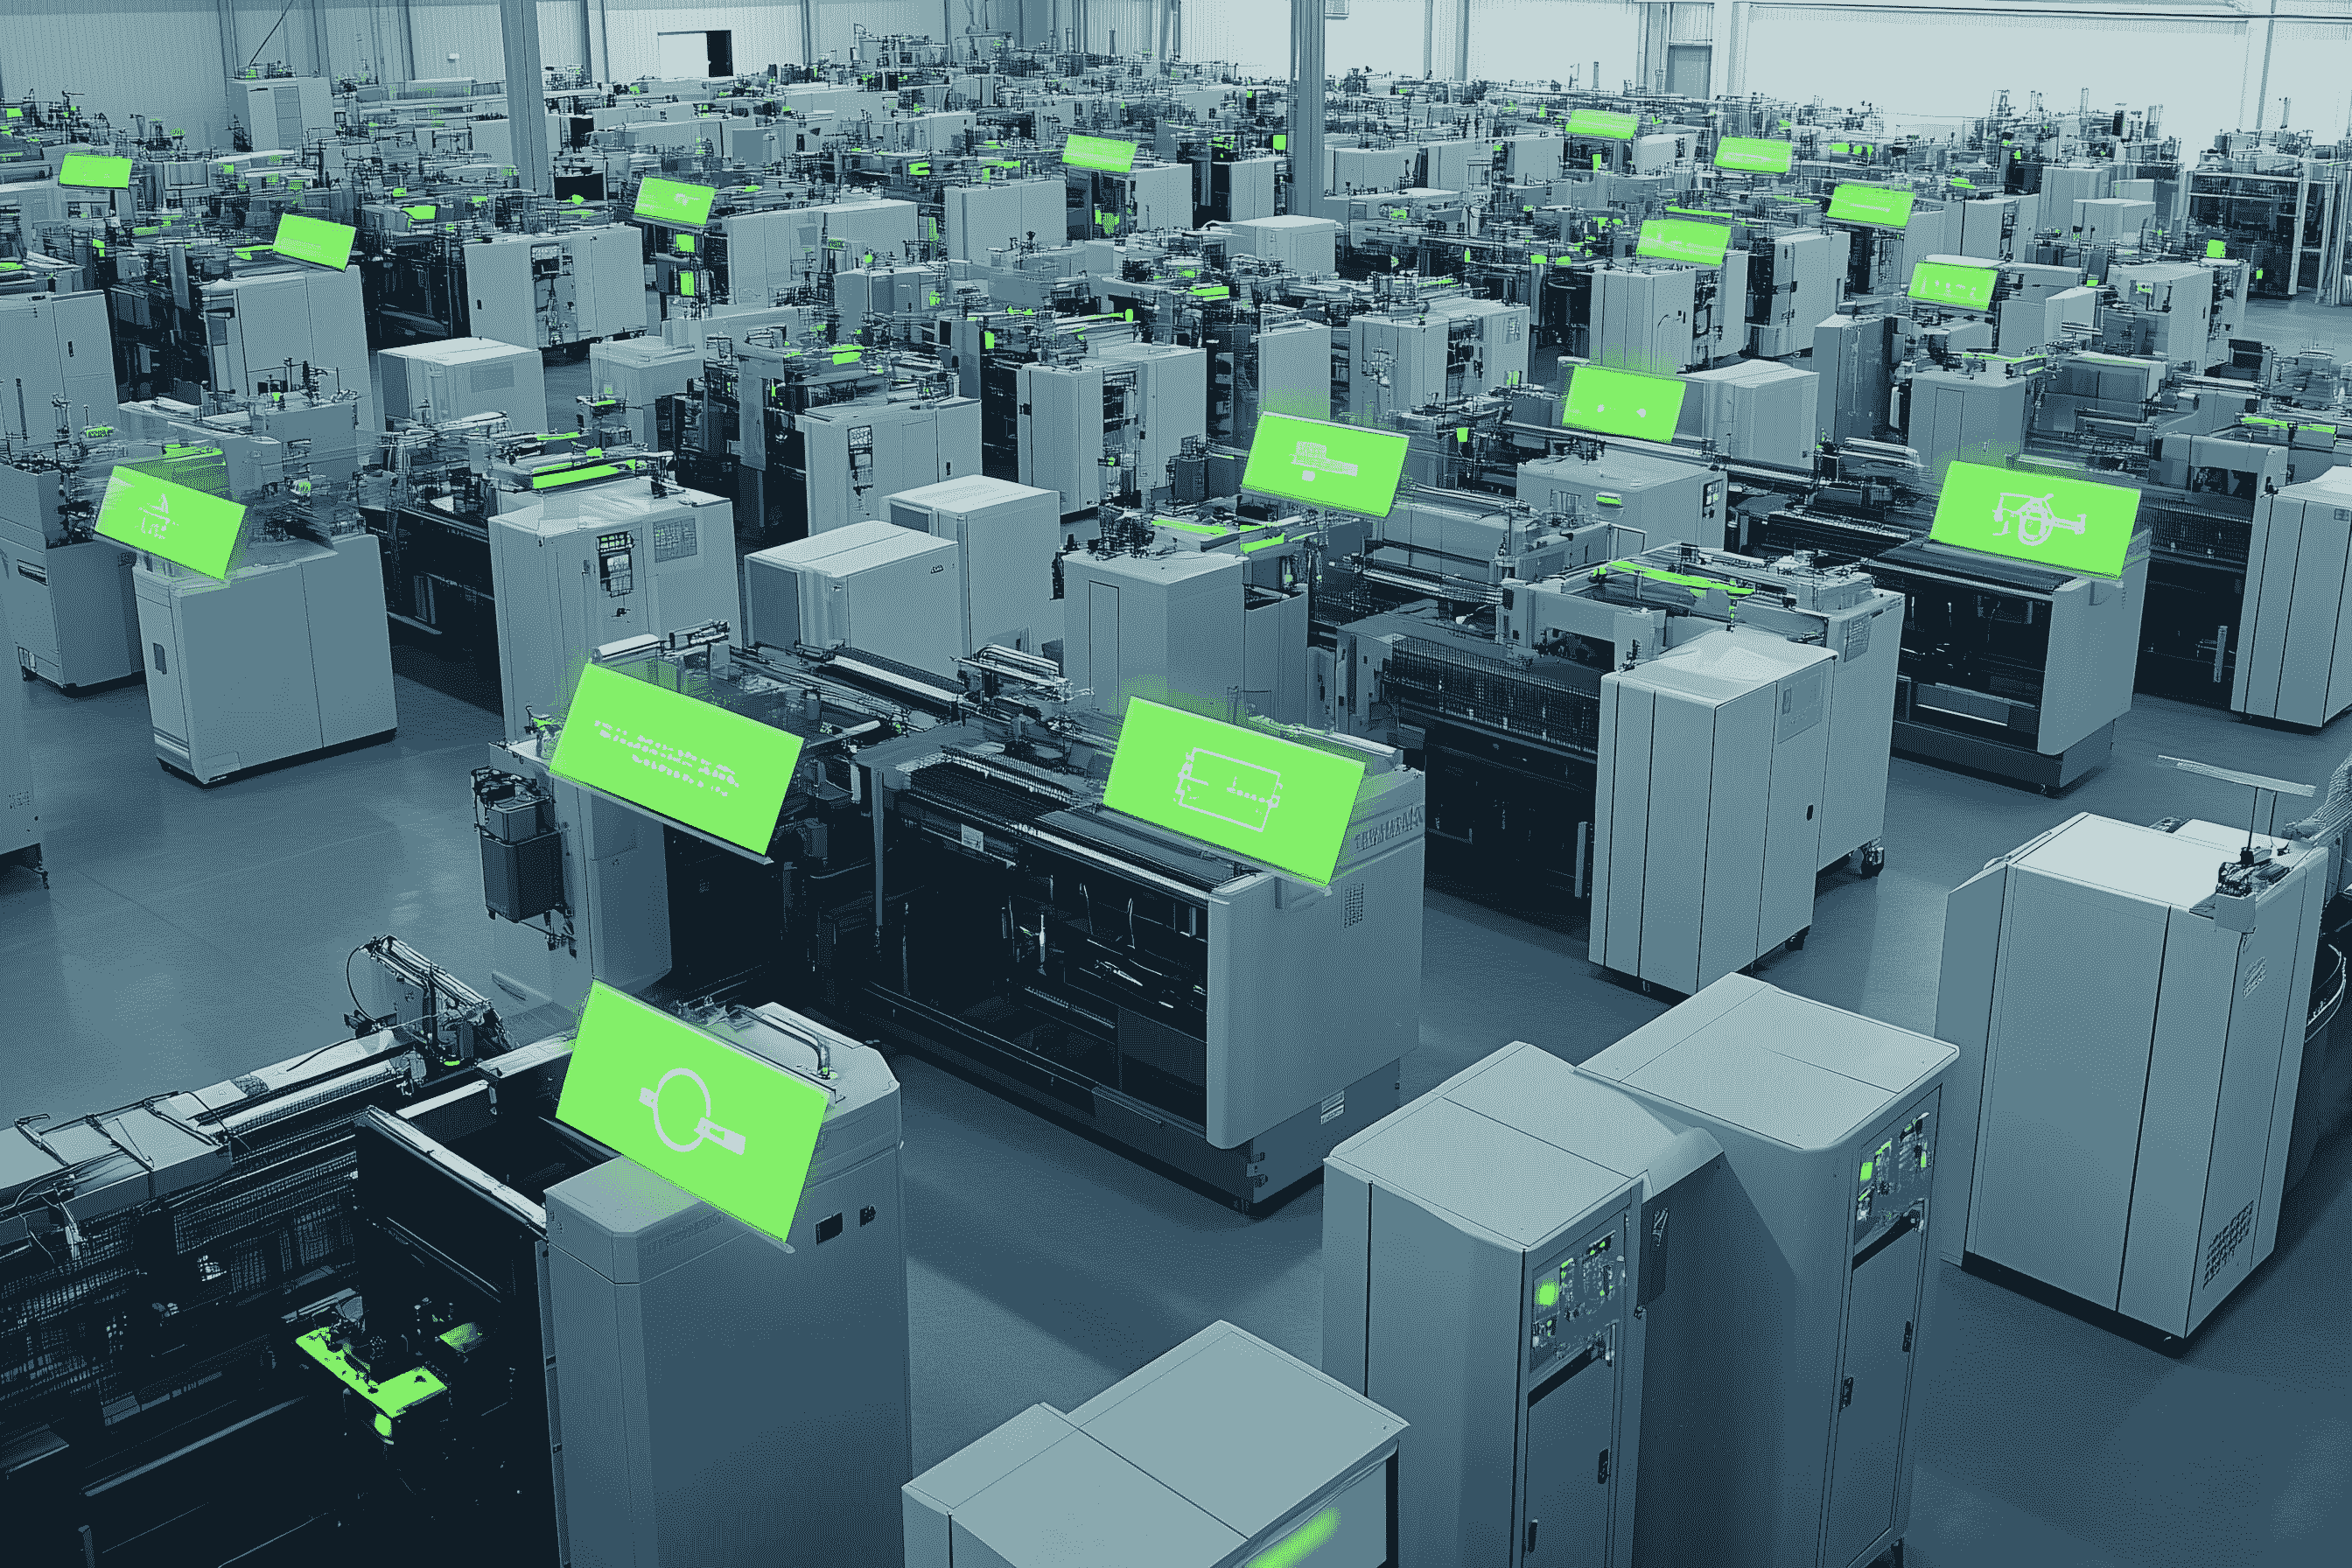
When using injection molding machines from various manufacturers, gaining insight into current and past production or machine status can be challenging. With OSPHIM-WEB, you can use predefined dashboards per machine and customize them to monitor key process parameters. Analyze time ranges or subscribe to real-time updates for monitoring and production insights.
Discover machine potential
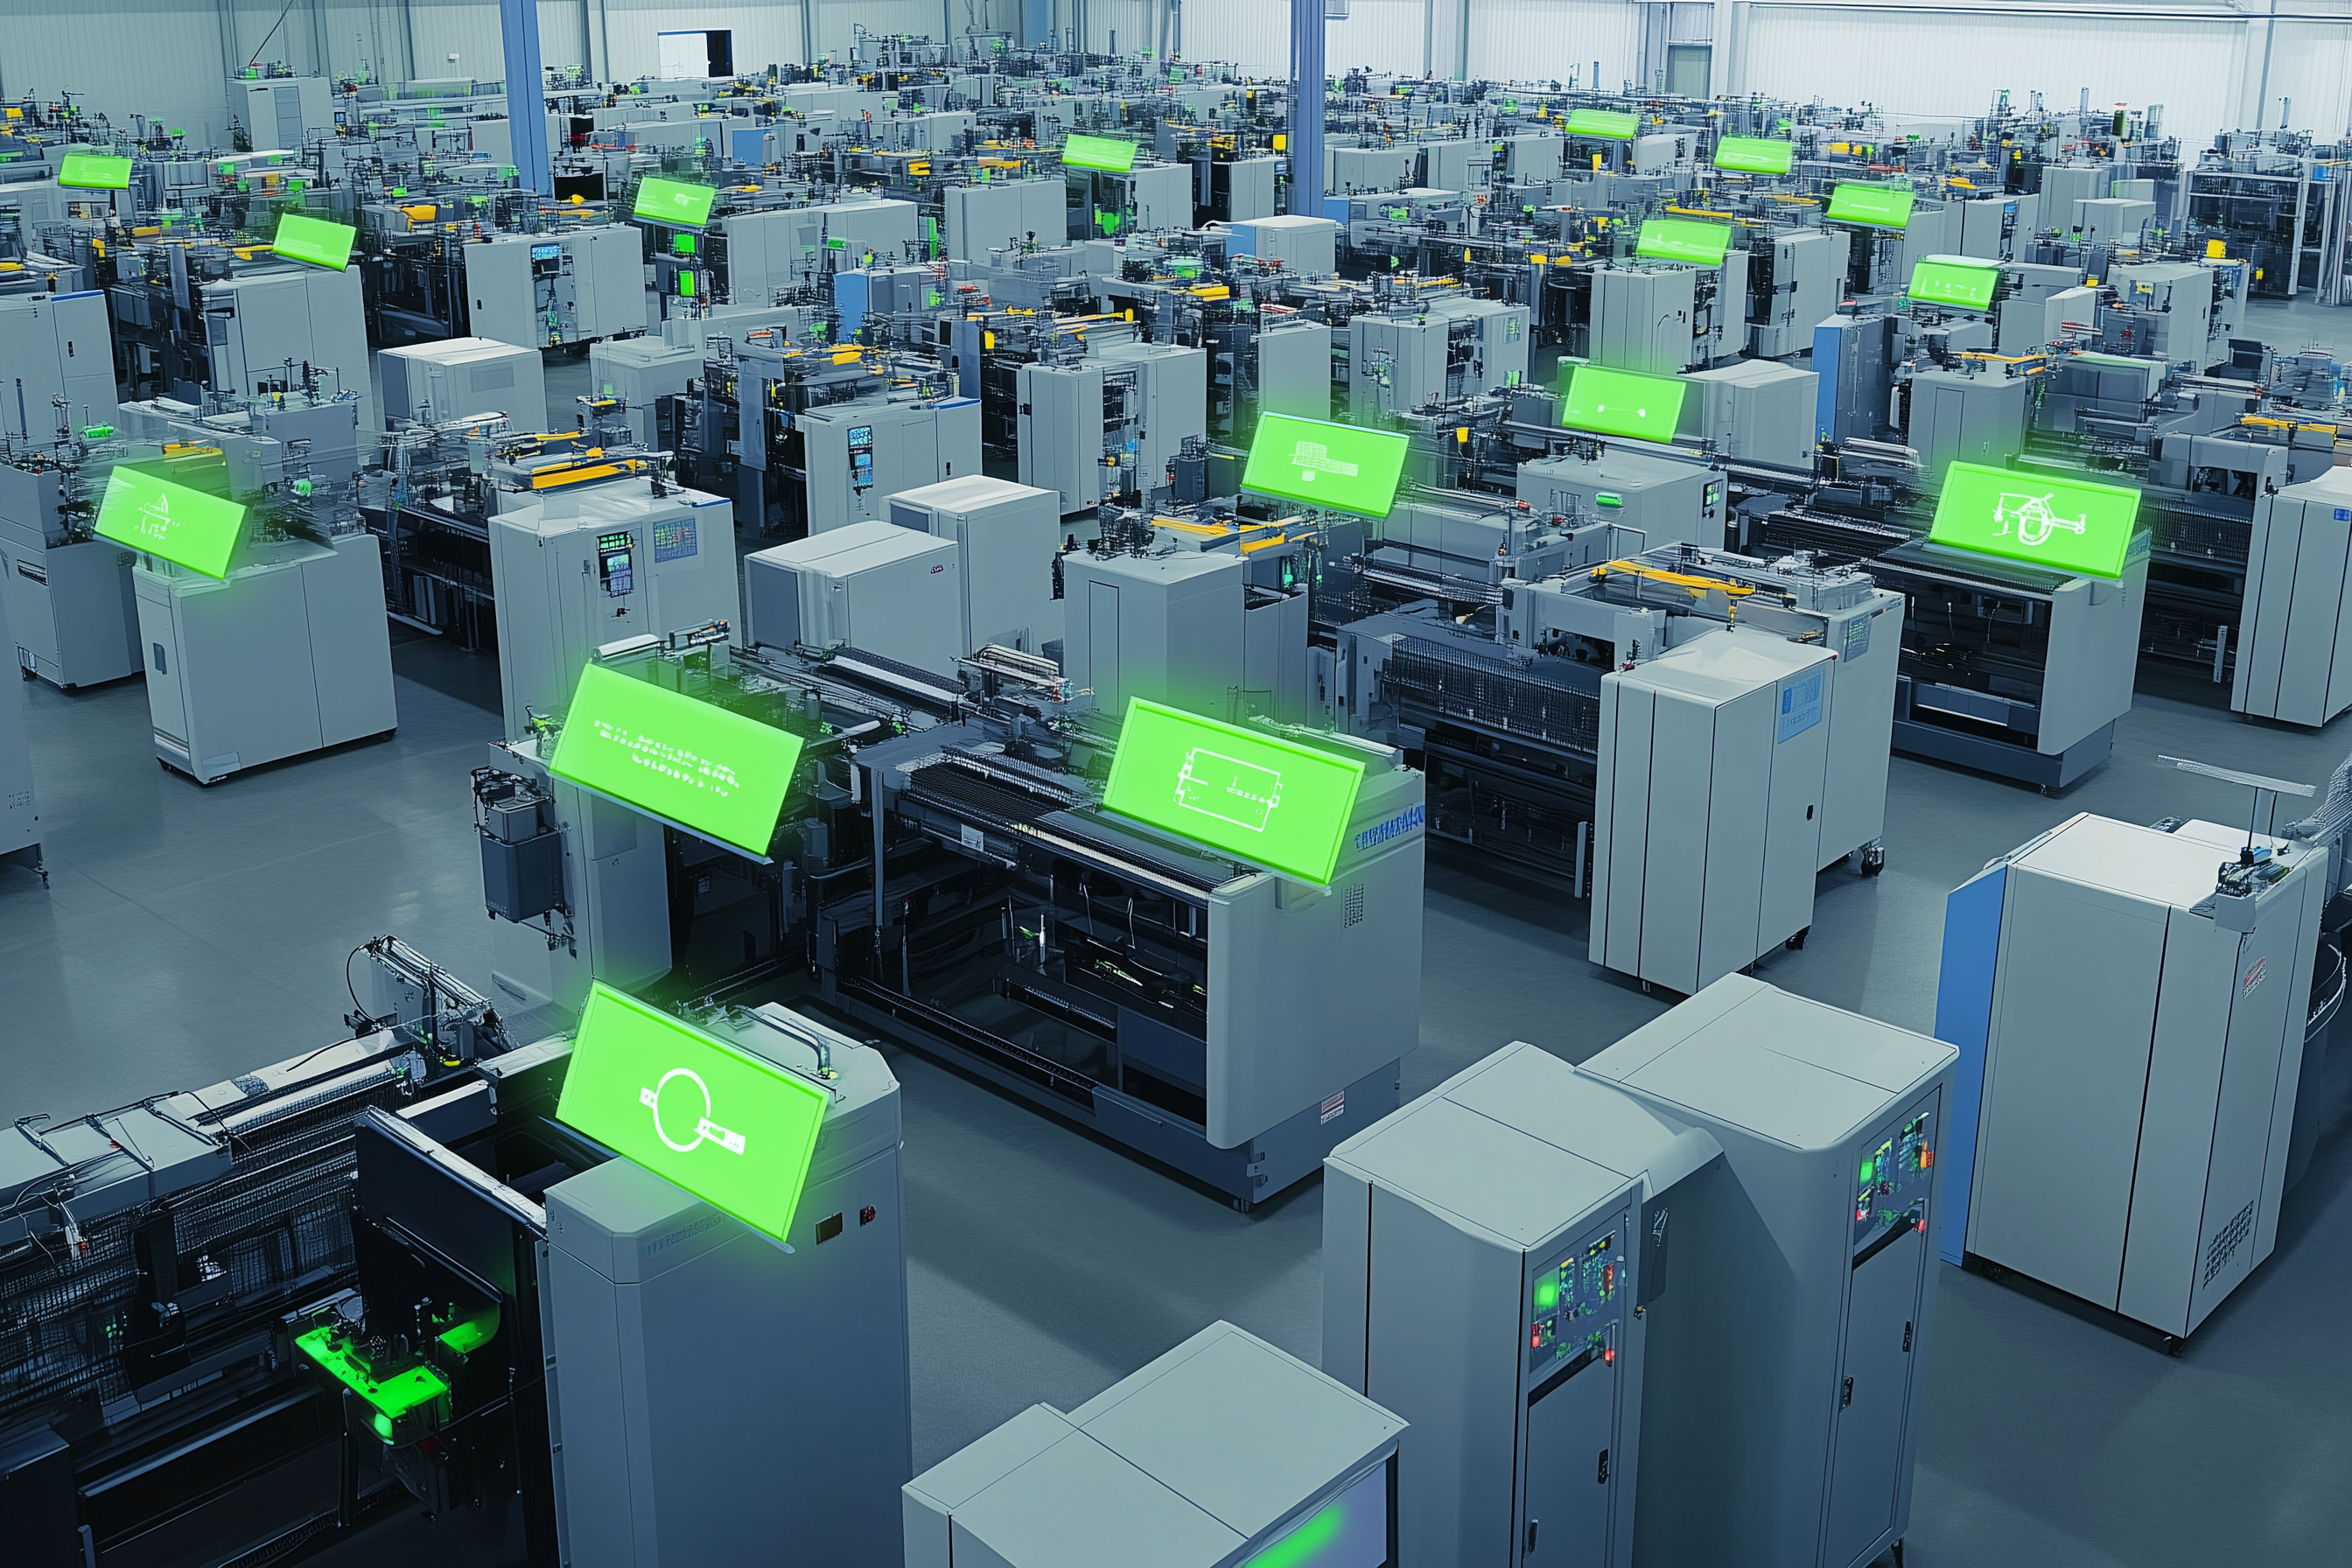
When multiple machines run in parallel or on repeat, comparing their performance across processes or production orders is crucial. With OSPHIM-WEB, you can create a dashboard based on registered machines to compare key process parameters such as cycle time and energy consumption. Additionally, you can download data and visualizations as detailed reports for further analysis.
